"No certain explanation for the poor repeatability of glaze ice shapes is available at this time."
NASA-TM-83556.
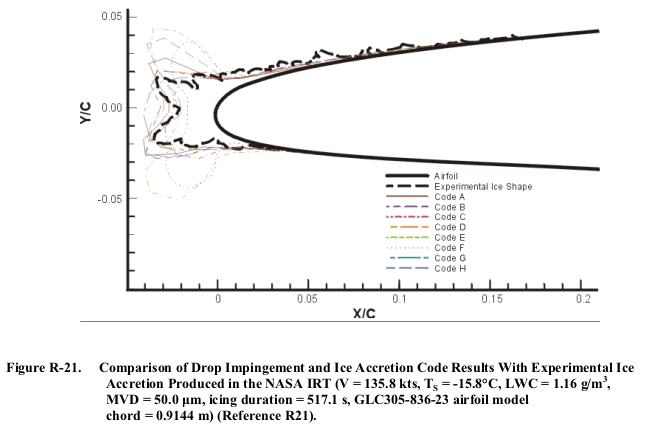
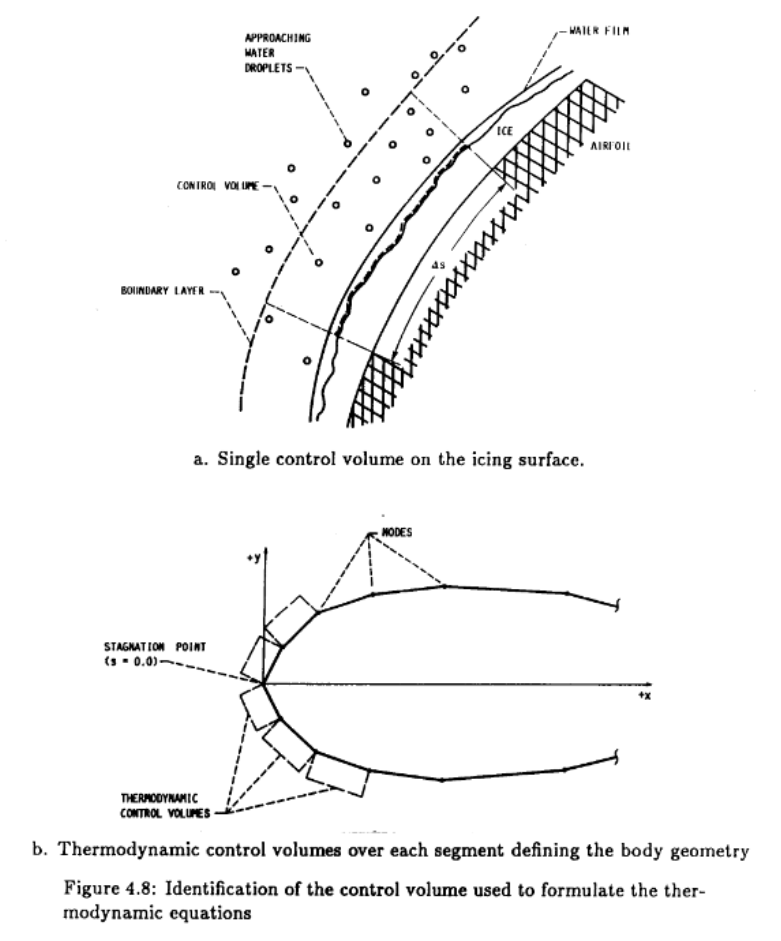
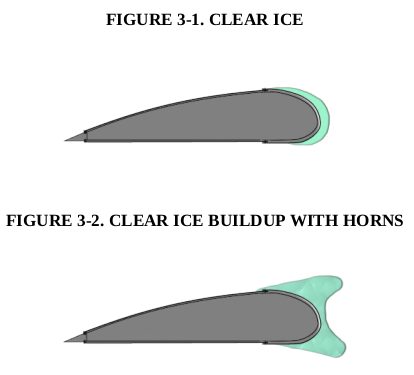
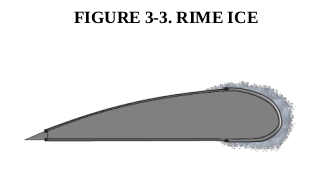
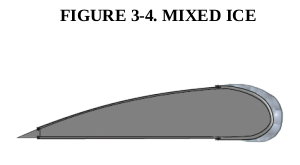
 Public Domain image from AEDC-TR-87-23.
Summary
We have seen several attempts to correlate drag for an airfoil with icing conditions.
Here, we will review prior correlations, and refine the methods to achieve a
better, more widely applicable correlation.
Prior Correlations
One significant correlation is from NASA-TM-83556 1, that used test control parameters such as total temperature, LWC, and airspeed:

Public Domain image from NASA-TM-83556.
Another is from AEDC-TR-87-23 2, which used the calculated leading edge freezing fraction (N):
Public Domain image from AEDC-TR-87-23.
About the lines on Figure 3, AEDC-TR-87-23 states:
read moreThe curves for these figures were drawn as the author interpreted the data.
The curves are similar in shape because of the functional dependency of N on test conditions that affect the change in ice shape and, thus, Cd. Again, it depends …