"our knowledge of aircraft icing and the penalties associated with it has not changed substantially in the last forty to fifty years" 1
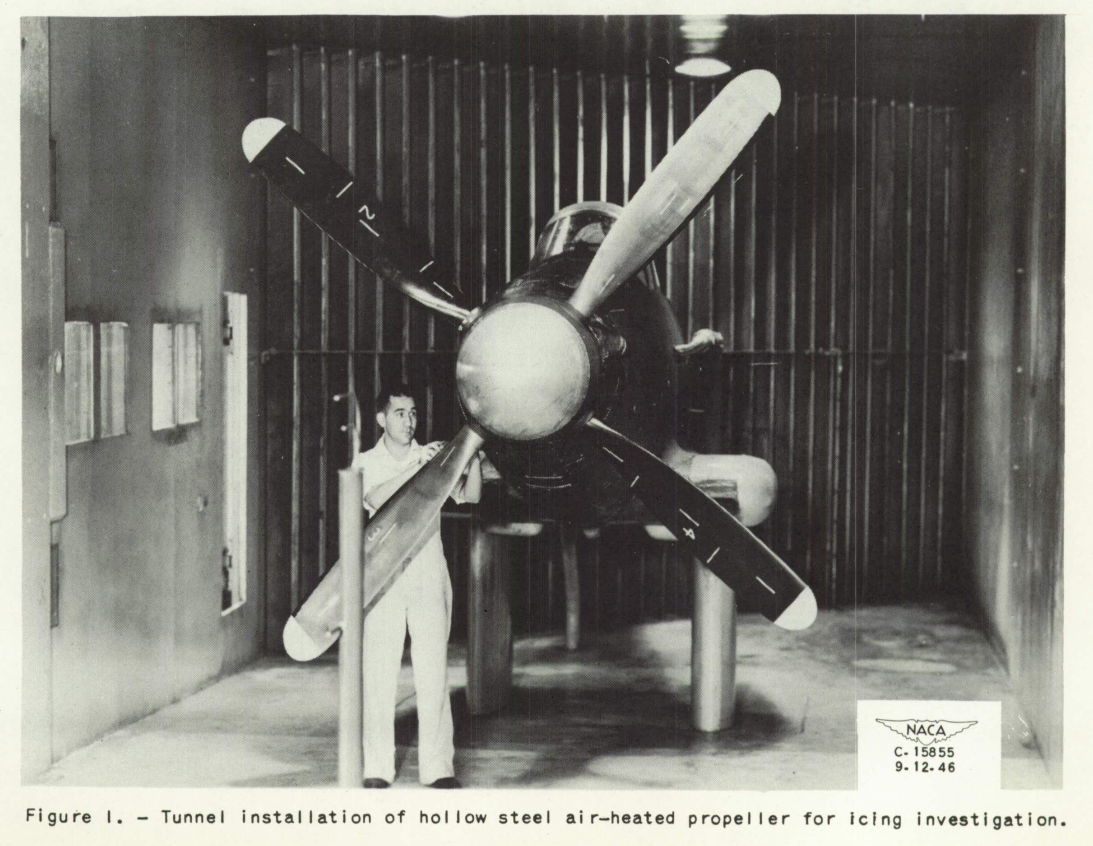
From NACA-TN-1586. I believe that this is Porter Perkins, circa 1946.
Summary
The three areas of the many and varied contributions of Porter Perkins are reviewed.
Discussion
I will focus on three areas of Porter Perkins' publications:
- Foresight about supercooled large drop (SLD) icing
- A shift in instrument calibration
- Contributions to the Appendix C icing regulation
Foresight about supercooled large drop (SLD) icing
I am not sure that I agree with the quote at the top (from 1993) now. A lot of things have happened in three decades.
Perkins and Rieke 1 foreshadowed in 1993 the potential effects of large-size water-drop icing conditions, now commonly termed supercooled large drop (SLD) icing:
[Emphasis added]
Protection from "Severe" icing encounters is not possible by definition. Likewise, there is little if any protection from very large droplet sizes when ambient temperatures are near freezing because buildups aft of the protected surfaces are possible due to "Runback" on the non protected surfaces. Total coverage at the present state-of-the-art is impractical.
In 1994 an accident occurred near Roselawn, Indiana, USA, that was later attributed to SLD icing 2. This set off a multinational effort to better understand such icing conditions and their effects on aircraft. New regulations ("Appendix O") were published in 2014 3.
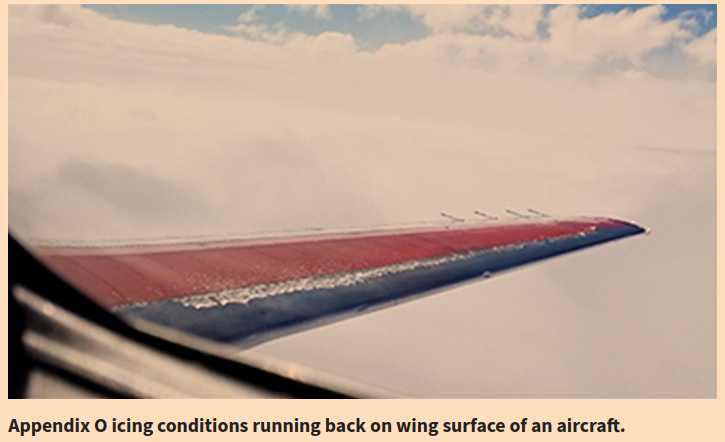
from FAA "In-Flight Icing", faa.gov/nextgen
Readers may note a 20-year interval between the accident and new regulations. There were intermediate actions, such as Airworthiness Directive being published, and much basic research into icing and the effects of ice shapes. The complete story is beyond the scope of this post.
Others of Perkins' publications included mentions of large drop icing:
- Perkins, Porter J.: Summary of Statistical Icing Cloud Data Measured Over United States and North Atlantic, Pacific, and Arctic Oceans During Routine Aircraft Operations. NASA Memo 1-19-59E, 1959. archive.org
- Lewis, William, and Perkins, Porter J.: A Flight Evaluation and Analysis of the Effect of Icing Conditions on the PG-2 Airship. NACA-TN-4220, 1958. ntrs.nasa.gov
A shift in instrument calibration
As we saw in Conclusions of the Meteorological Instruments Thread, in "Review of Icing Criteria; William Lewis" from the 1969 Aircraft Ice Protection Report of Symposium, William Lewis summarized icing criteria, such as drop size and LWC values. He had comments on the NACA era instrumentation that was used to measure them.
Problems were encountered with the calibration, but since the device was so well adapted to automatic operation, arrangements were made with the airlines to begin an extensive program of data collection. As the program progressed, difficulties with the calibration proved to be more serious than had been anticipated, but data collection continued to expand. The net result was a large amount of data providing useful information on such factors as horizontal and vertical extent of icing conditions, but considerable uncertainty remains as to the meaning of indications of icing rate and liquid water content. The data from this program was published in three reports (ref. 2, 3, 4) each containing tabulations of liquid water content and a description of calibrations in use at that time. Apparently, as the data were worked up the calibration was changed from time to time as a result of further studies. I see no other possible explanation for the striking differences among the three reports.
"ref. 2, 3, 4" are NACA-RM-E52J06 4, NACA-RM-E55F28a 5, and NASA Memo 1-19-59E 6, which we saw in Meteorology publications by Porter Perkins.
One convenient statistic that may be used for an overall comparison of data from various sources is the 99th percentile of liquid water content from the entire distribution without classification by either drop size or temperature. This comparison is shown in figure 2. Values from various sources are plotted on a time scale to provide historical perspective and show the apparent trend in the airline data. The airline data and the Russian data from scheduled soundings probably contain a negligible fraction of measurements in cumulus clouds, and are therefore comparable to the early research data from stratiform clouds.
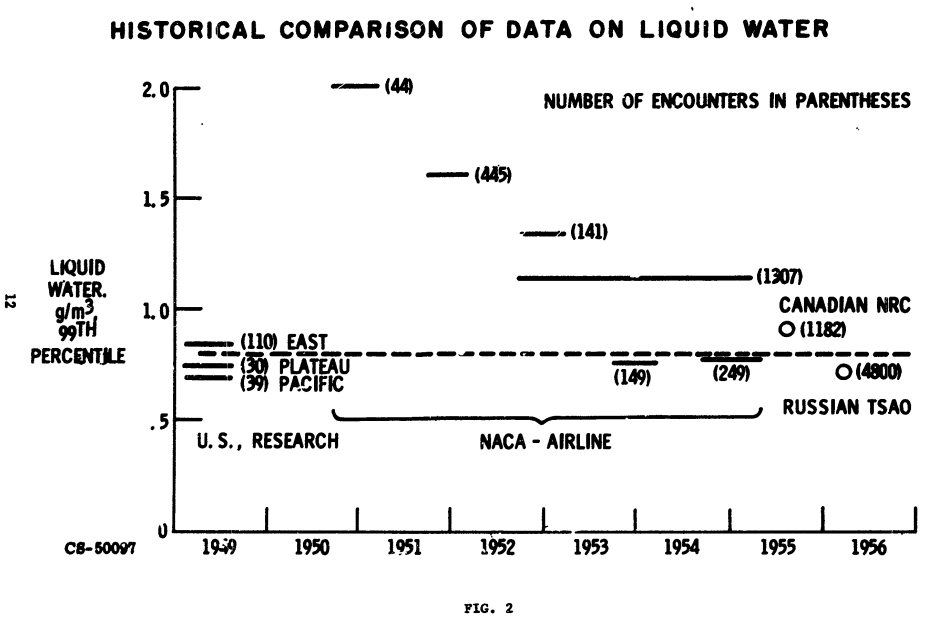
Figure 2 shows the diminishment in "NACA - Airline" LWC values, 1950 to 1955.
Perkins' description is much briefer (NASA-MEMO-1-19-59) 6:
These results are lower than preliminary values published in an interim report (ref. 3). The data presently reported are considered more reliable because they are based on a larger sampling of data, and on improved installation and operation of the icing meter. A comparison of the data from this program with values from multicylinder measurements taken earlier (ref. 3) shows that higher water contents (0.5 g/cu m) averaged over short distances exist somewhat more frequently than was previously indicated.
"ref. 3" is NACA-RM-E55F28a 5.
An innovation between NACA-RM-E55F28a and NASA Memo 1-19-59E that was perhaps under-emphasized was:
the operating characteristics of the sensing probe as discussed in appendix B
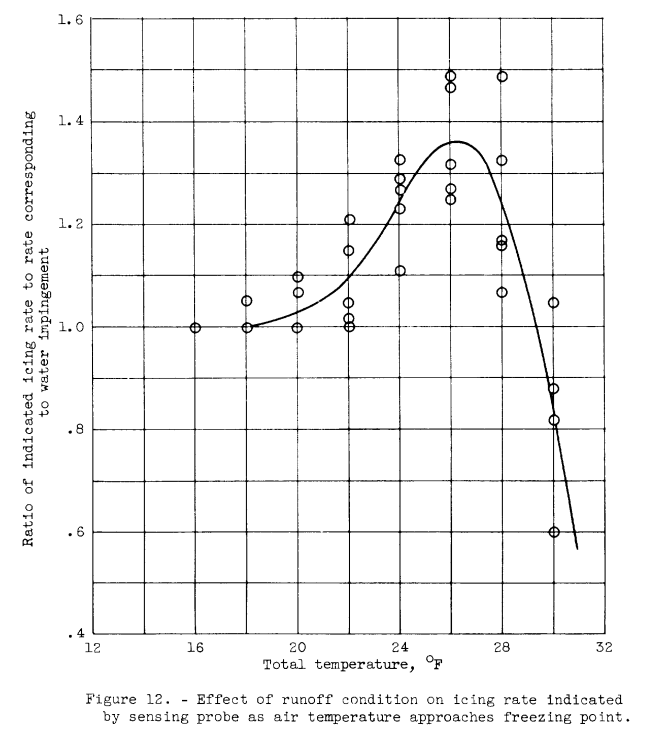
Note that for many temperatures, an unadjusted reading would be too high. I have not found this calibration curve in other publications, and the effect may be large enough to explain the differences from results prior to NASA Memo 1-19-59E.
Contributions to Appendix C
We will look at how the values in Appendix C 7 were determined, and how Perkins' publications could have influenced that.
The derivation of the values in Appendix C Figure 1 is straight-forward. Data from NACA-TN-1855 8 maps directly onto Figure 1. However, note that the values at -40F were not included.
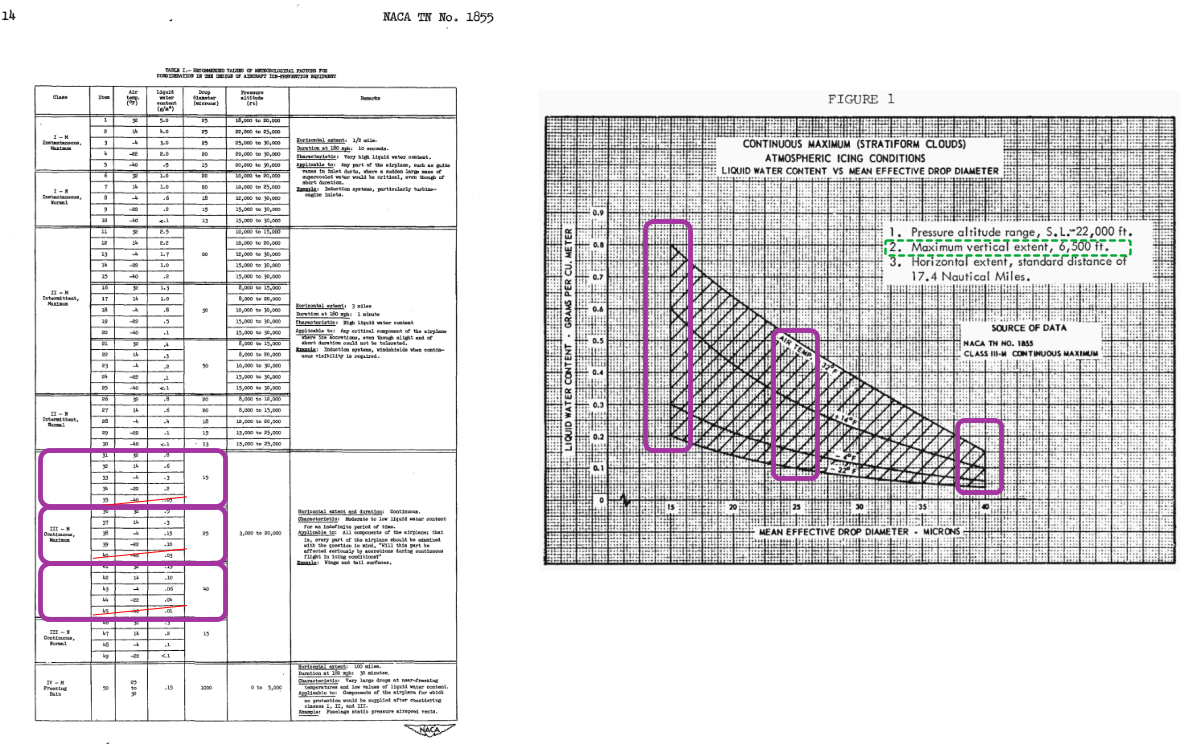
The "Maximum vertical extent, 6500 ft" appears to have come from
NACA-TN-2306 9:
[emphasis added]
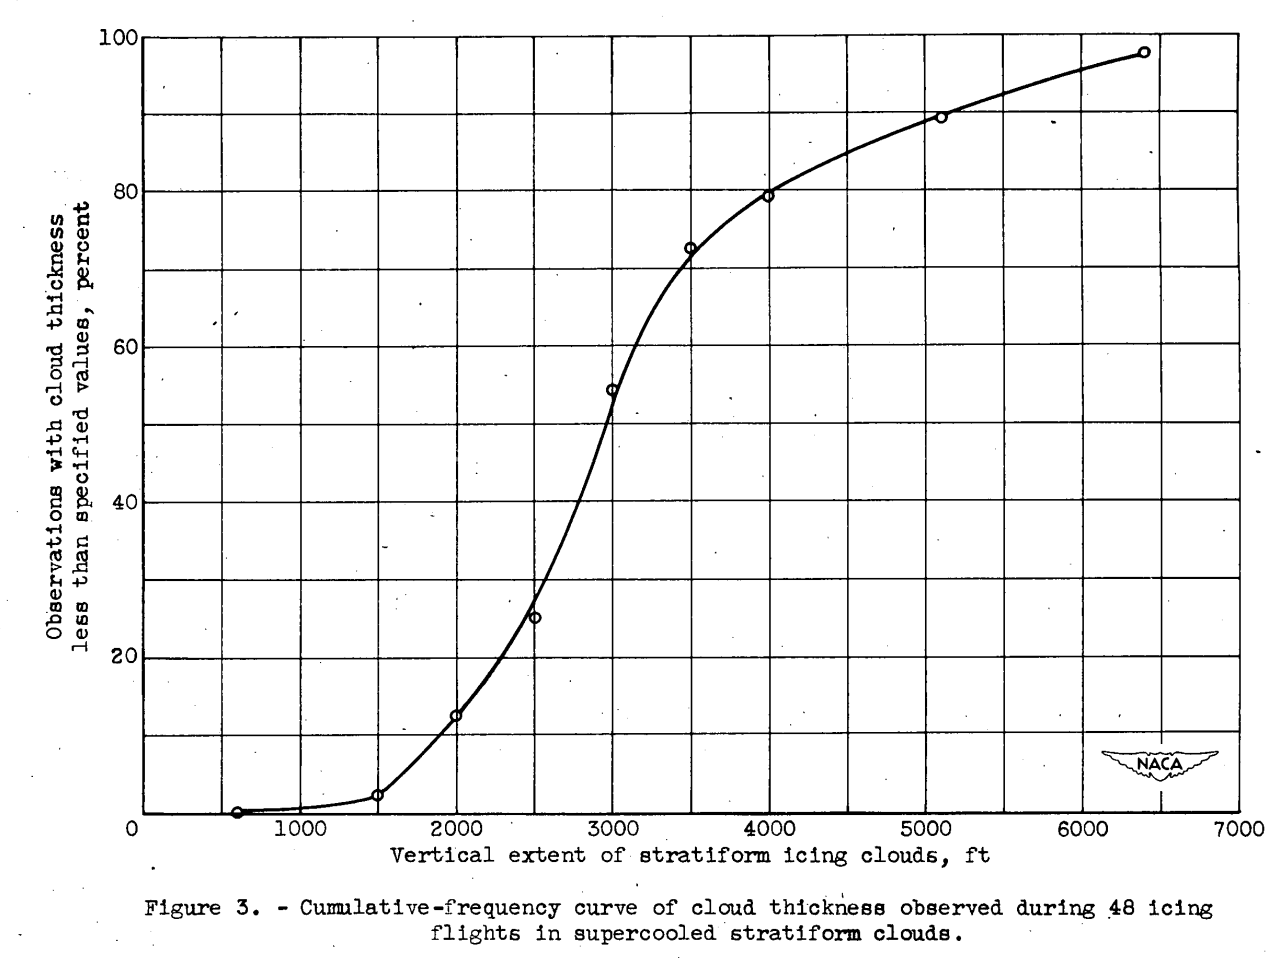
Vertical extent of stratiform icing clouds. -
The depth of continuous icing clouds is a factor to be considered in flight navigation to reduce the rate of ice accretion, particularly with unprotected aircraft. In order to provide information on the average and the maximum vertical extent of continuous or nearly continuous icing conditions, data were obtained when feasible either by surveying the clouds or by noting the height of the cloud tops in relation to the height of the cloud bases reported by weather observing stations over the flight area. Reliable data were obtained for a total of 48 flights during four winters of icing flights. The observations were generally obtained over terrain where orographic effects were considered negligible. The maximum depth of the icing clouds was not determined as the thickness of one particular icing cloud layer in every case. Two or more cloud layers sufficiently close together, or with varying bases and tops such that icing conditions were unavoidable without frequent changes in flight altitude, were considered as one cloud layer. The maximum vertical extent of multiple cloud layers was approximately 6500 feet as indicated in figure 3. Eighty percent of the icing conditions was less than 4000 feet in vertical extent. The average observed vertical extent of stratiform icing clouds was approximately 3000 feet. Flight surveys indicated a maximum depth of 3500 feet. for any single cloud layer, which is in approximate agreement with the discussion of cloud-thickness values presented in reference 2.
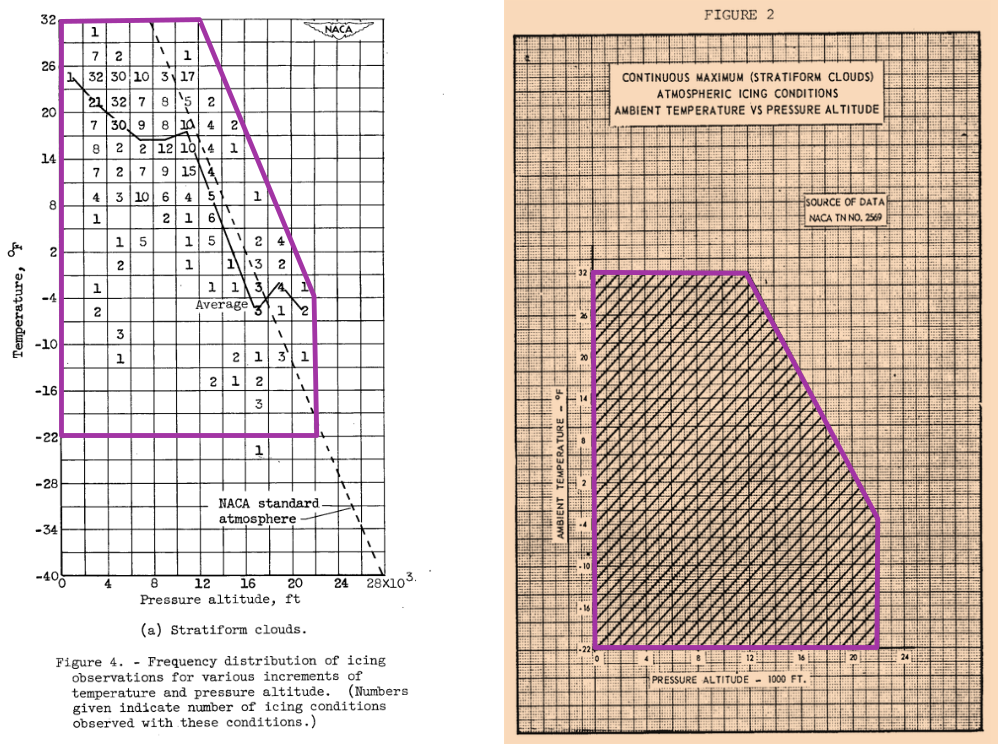
The derivation of Appendix C Figure 2 is shown below. The frequency of observations of icing at temperature and altitude values was plotted in NACA-TN-2569 10 Figure 4, and an envelope was drawn around it. Note that a point near -24F, 16000 ft. was not included, without explanation.
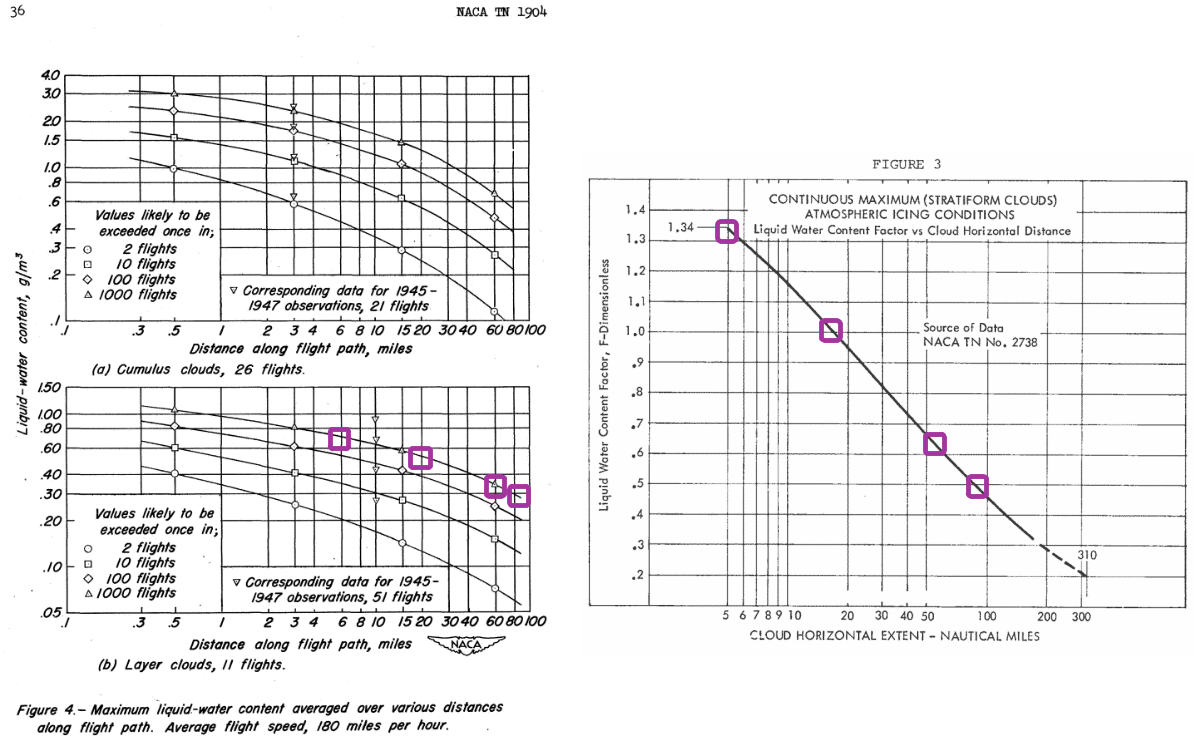
How Appendix C Figure 3 was derived is a long and involved story, perhaps meriting its own thread in the future. For now, note that Figure 3 cites NACA-TN-2738 11 as the source. However, NACA-TN-2738 cites NACA-TN-1904 12 as the source for its data. If one does some arithmetic with the NACA-TN-1904 values, one can get values along the Appendix C Figure 3 curve. The Figure 3 "F" value can be calculated:
F = (LWC at distance) / (LWC at 17.4 nmi)
Note that NACA-TN-1904 used log(LWC) in the plot, while Appendix C used linear "F".
Jeck 13 notes that the NACA-TN-2738 curve was "extrapolated anonymously" (reference 13 provides a good, but not quite complete, story of Appendix C Figure 3).
So far, we have no values that were derived from a publication by Porter Perkins.
What is left that he could have been contributed?
NACA-RM-E52J06 8 noted that:
The majority of the research flights into icing conditions were made by attempting to select weather conditions, flight paths, and altitudes, which would yield heavy or continuous icing. Multiple traverses were often made when such conditions were found. It is impossible, therefore, to determine from this information the extent or frequency of specified icing conditions that would be encountered during normal flight operations such as those experienced by airlines on routine schedules.
The data from the Meteorology publications by Porter Perkins were in this theme, assessing what airlines could actually encounter.
While Perkins' meteorological publications were too late to contribute to Appendix C, much of the flight data was gathered by 1955. Preliminary data could have provided assurances that data from typical airline routes were not greatly different from the prior research data.
Also, while I have not found anyone credited for making the actual measurements in-flight, it is possible that it Perkins made some of them, as his years at NACA included 1946 to 1952, when the bulk of the flight test data that went into Appendix C was gathered (note that the primary sources cited in Appendix C were published by 1952).
Conclusions
Perkin's publications have a lasting legacy.
They makes up a substantial portion of the Supercooled Cloud Database used in DOT/FAA/AR-07/4 13. The Supercooled Cloud Database has over 28,000 nmi of measure data in icing conditions. More than 1/3 of the total miles were NACA measurements made in the years 1952 to 1955, a period covered by the Meteorology publications by Porter Perkins.
The measurements made in 1952 to 1955 largely used the Pressure-type Icing Rate and Accretion Meter (PIRAM), described in NACA-RM-E51E16.
The Supercooled Cloud Database also includes more recent ("modern") measurements. Jeck 13 notes that:
Analyses have shown that the NACA data and modern data compared favorably with each other in the determination of LWC and MVD even though the measuring techniques were radically different.
Citations
Perkins' publications are cited 15 times in the Aircraft Icing Handbook 14.
Related
This is part of the Porter Perkins series.
Notes
-
Perkins, Porter, and William Rieke. "Aircraft icing problems-After 50 years." 31st Aerospace Sciences Meeting, AIAA-93-0392. 1993. arc.aiaa.org ↩↩
-
American Eagle Flight 4184, October 31, 1994. wikipedia.org ↩
-
25.1420 Appendix O Supercooled large drop icing conditions ecfr.gov ↩
-
Perkins, Porter J.: Preliminary Survey of Icing Conditions Measured During Routine Transcontinental Airline Operation. NACA-RM-E52J06, 1952. ntrs.nasa.gov ↩
-
Perkins, Porter J.: Statistical Survey of Icing Data Measured on Scheduled Airline Flights over the United States and Canada from November 1951 to June 1952. NACA-RM-E55F28a, 1955. ntrs.nasa.gov ↩↩
-
Perkins, Porter J.: Summary of Statistical Icing Cloud Data Measured Over United States and North Atlantic, Pacific, and Arctic Oceans During Routine Aircraft Operations. NASA Memo 1-19-59E, 1959. archive.org ↩↩
-
Jones, Alun R., and Lewis, William: Recommended Values of Meteorological Factors to be Considered in the Design of Aircraft Ice-Prevention Equipment. NACA-TN-1855, 1949. ntrs.nasa.gov ↩↩
-
Kline, Dwight B., and Walker, Joseph A.: Meteorological Analysis of Icing Conditions Encountered in Low-Altitude Stratiform Clouds. NACA-TN-2306, 1951. ntrs.nasa.gov ↩
-
Hacker, Paul T., and Dorsch, Robert G.: A Summary of Meteorological Conditions Associated with Aircraft Icing and a Proposed Method of Selecting Design Criterions for Ice-Protection Equipment. NACA-TN-2569, 1951. ntrs.nasa.gov ↩
-
Lewis, William, and Bergrun, Norman R.: A Probability Analysis of the Meteorological Factors Conducive to Aircraft Icing in the United States. NACA-TN-2738, 1952. ntrs.nasa.gov ↩
-
Lewis, William, and Hoecker, Walter H., Jr.: Observations of Icing Conditions Encountered in Flight During 1948. NACA-TN-1904, 1949. ntrs.nasa.gov ↩
-
Jeck, Richard K. "Advances in the characterization of supercooled clouds for aircraft icing applications". No. DOT-FAA-AR 07-4. Office of Aviation Research and Development, Federal Aviation Administration, 2008. tc.faa.gov ↩↩↩↩
-
“Aircraft Icing Handbook Volume 1.” DOT/FAA/CT-88/8-1 (1991) apps.dtic.mil.
Also note that there was a perhaps little known update in 1993 (that did not affect the pages of interest herein): apps.dtic.mil. ↩