"An approach to characterizing the severity of an icing encounter is to relate that encounter to the frequency of its occurrence." 1
Introduction
Three publications with Porter Perkins as an author are included here. Two publications are related, as they cover a flight test campaign to gather detailed ice shape data. The third publication describes a potential improvement to ice protection.
There is much to see in these publications with multiple authors, and I will focus on what I believe to have been Perkins' contributions.
Ice Shapes, NASA TM 83564 1 and NASA TM 86906 2
NASA TM 83564:
Summary
This paper deals with the initial results of the NASA Lewis Research Center's flight research in quantifying the performance of an aircraft in various measured icing conditions. Flight research performed in natural icing conditions supports a number of major program elements at NASA. One of these elements is to develop analytical methods (computer codes) that predict aircraft performance degradation in a given icing condition. A major problem in developing these codes has been the lack of an experimental data base where measurements of the natural icing environment were associated with a corresponding measurement of aircraft performance degradation.
NASA TM 83564:
Abstract
Aircraft icing flight research was performed in natural icing conditions with a typical twin engine commuter type aircraft. Development of a data base consisting of icing cloud parameter measurements, ice shapes, and aerodynamic measurements was begun. Results from five icing research flights are presented. During research icing encounters, icing cloud parameters such as temperature, liquid water content, and droplet size were measured. After the icing encounter, ice shapes were documented and aerodynamic measurements were taken. The ice accretion shape on the wing was documented with a stereo photography system. The increase in wing section drag was measured with a wake survey probe. The overall aircraft performance loss in terms of lift and drag coefficient changes was obtained by taking steady level speed/power measurements. Selective deicing of airframe components was performed to determine their contributions to the total drag increase. Engine out capability was analyzed for the iced aircraft. It was shown that the stereo photography system can be used to document ice shapes in flight and that the wake survey probe can measure increases in wing section drag caused by ice. On one flight, the wing section drag coefficient (Cd) increased approximately 120 percent over the uniced baseline at an aircraft angle of attack of 6°. On another flight, the aircraft drag coefficient (CD) increased by 75 percent over the uniced baseline at an aircraft lift coefficient (Cl) of 0.5.
The instruments used in NASA TM 83564:
Instrumentation
Icing Cloud Parameters
Measurements were made of cloud liquid water content, cloud droplet size distribution, volume median diameter, air temperature, ice accretion rate, and duration of the icing encounters. Photographs were taken in flight of the ice accretions on the outboard section of the wing leading edge and of other airframe components visible from the cockpit and cabin.
Instrumentation included:
For liquid water content: Johnson and Williams (J-W) heated wire produced by Cloud Technology (fig. 2(a));
For cloud droplet size distribution and volume median diameter: rotating multi-cylinder (fig.2(b));
For air temperature: platinum resistance total temperature probe produced by Rosemount (fig. 2(c));
For ice accretion: Pressure-type Icing Rate and Accretion Meter (PIRAM) developed by NACA (fig 2(d)).
For NASA TM 86906, a "sooted slide droplet catcher" was also included.
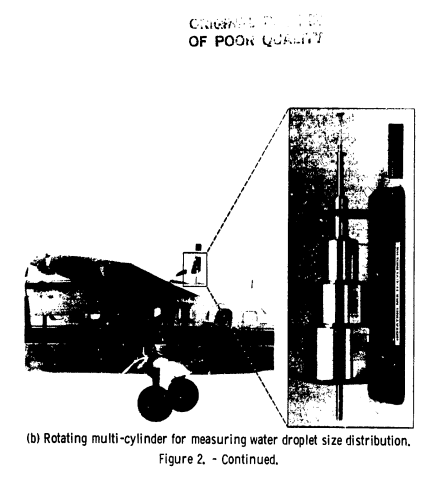
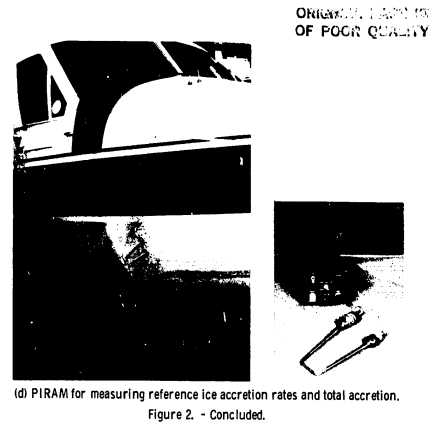
The barely legible stamp near the top reads "ORIGINAL PAGE IS OF POOR QUALITY".
I believe that this was the latest icing flight test use (1984) of the rotating multicylinder or sooted slide droplet catcher instruments. A later test in the series (flight in 1985) 4 included the PIRAM, but used a forward scattering spectrometer probe and an optical array probe for drop size measurement. The latest use of the PIRAM may have been 1985.
Icing parameters such as liquid water content, temperature, cloud droplet sizes, and ice accretions were measured with icing instruments mounted on the research aircraft. Continuous on-line reading of these instruments provided a quantitative display of the icing environment, Thus, when icing was detected the extent of the icing could be monitored and controlled by holding within the icing area.
Following each measured icing encounter, level flight speed/power runs were made from maximum obtainable level flight speed to a speed just above stall. When possible, repeat runs were made after selectively deicing the wings and empennage. Flight data were reduced to provide plots of the aircraft drag polar for the measured "iced" condition and a lift curve (CL vs. _) as referenced to the uniced or clean airframe baseline. In order to determine the effect of icing on engine-out performance capability, these data were also reduced to provide plots of thrust horsepower required vs. single engine power available.
Aircraft performance measurements are referenced to those characteristics of the icing condition that created the ice accretions. Performance degradation is primarily influenced by the amount and shape of the accumulated ice. The amount of ice was measured but shape was not quantitatively determined. In addition to presenting specific values of the icing variables, the icing encounters were characterized in terms of their relation to frequency of occurrence and the FAA icing cloud criteria for ice protection systems.
Glaze icing caused the greatest aerodynamic performance penalties in terms of increased drag and reduction in lift. Rime icing provided proportionately lower aerodynamic performance penalties.
Data acquired through this flight test program will provide a basis to develop aircraft performance prediction codes for icing conditions. One such code is being developed under a NASA Lewis Research Center grant by the Ohio State University. The geometry of the icing research aircraft, along with the measured icing environment and corresponding aircraft performance degradation data, will be used to provide a basis for the development of this code.
The icing conditions were summarized:
extracts from
NASA TM 83564 TABLE I. - ICING CLOUD DATA AND ACCRETION PROPERTIES FOR ICING FLIGHTS
| Flight: | 83-9 | 83-10 | 83-11 |
|---|---|---|---|
| Extent of encounter (nmi) | 72 | 59 | 106 |
| Static air temperature (C) | -4.4 | -4 | -10.6 |
| Average LWC (g/m^3) | 0.35 | 0.45 | 0.53 |
| Median volume drop diameter (micrometer) | --- | 13 | 13 |
| Type of ice | Glaze | Glaze | Rime |
| Shape of ice | Double ridged |
Double ridged |
Curved |
| Average accretion rate (in/hr) | 2.68 | 3.32 | 3.8 |
| Reference total accretion (inch) | 1.61 | 1.44 | 2.91 |
| (a) Frequency of occurrence (number of icing encounters to equal or exceed) |
1 in 250 | 1 in 100 | 1 in 200 |
| (b) Certification criteria (percentage of max LWC) | 81 % | 70 % | 104 % |
| Frequency as probability (NASA TM calculation) | 0.0040 | 0.01 | 0.005 |
extracts from
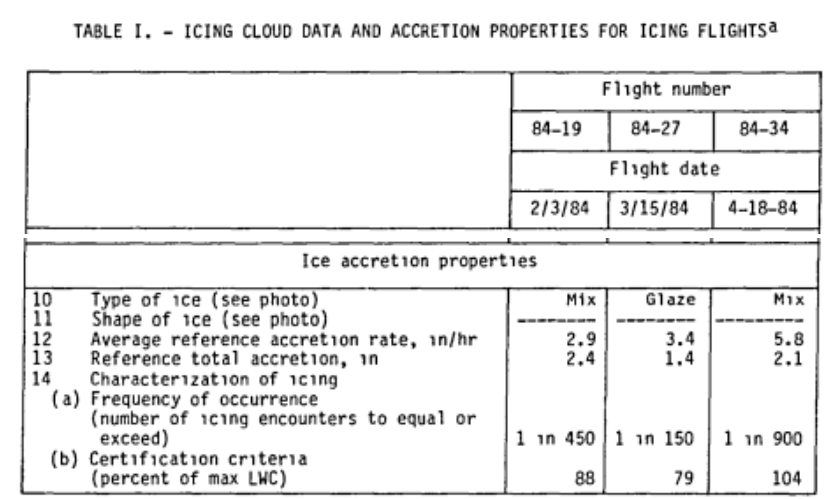
NASA TM 86906 TABLE I. - ICING CLOUD DATA AND ACCRETION PROPERTIES FOR ICING FLIGHTS
| Flight: | 84-19 | 84-27 | 84-34 |
|---|---|---|---|
| Extent of encounter (nmi) | 110 | 57 | 50 |
| Static air temperature (C) | -6.8 | -5.2 | -6.5 |
| Average LWC (g/m^3) | 0.30 | 0.34 | 0.58 |
| Median volume drop diameter (micrometer) | 11 | 15 | 10 |
| Type of ice | Mix | Glaze | Mix |
| Average accretion rate (in/hr) | 2.9 | 3.4 | 5.8 |
| Reference total accretion (inch) | 2.4 | 1.4 | 2.1 |
| (a) Frequency of occurrence (number of icing encounters to equal or exceed) |
1 in 450 | 1 in 150 | 1 in 900 |
| (b) Certification criteria (percentage of max LWC) | 88 % | 79 % | 104 % |
| Frequency as probability (NASA TM calculation) | 0.0022 | 0.0067 | 0.0011 |
The "Frequency of occurrence" calculations for these flights are rather complex, and are detailed in Reproducing NACA-TN-2738 calculations.
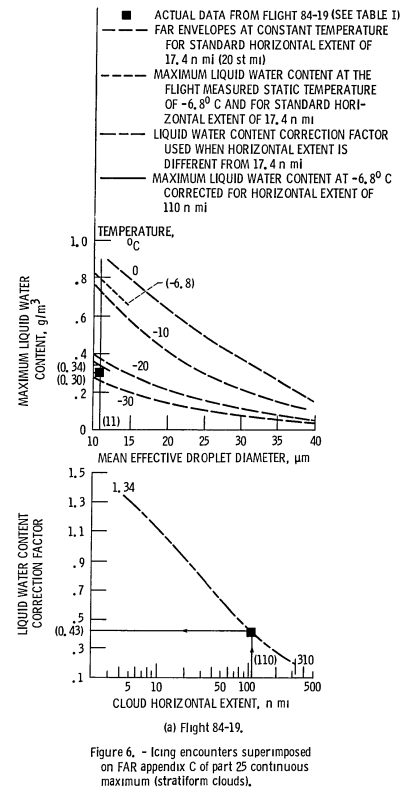
The calculation of "Certification criteria (percentage of max LWC)" are detailed in a figure:
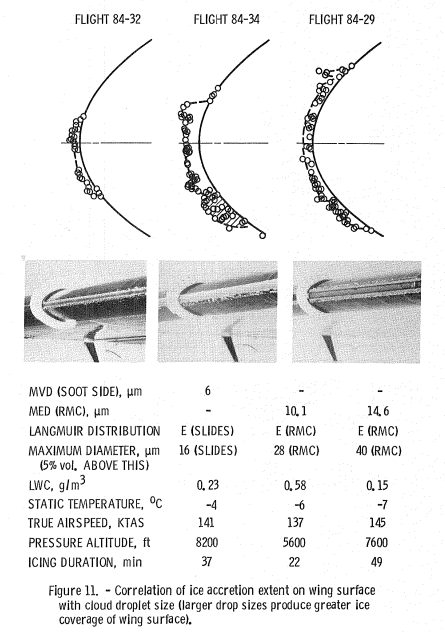
For NASA TM 86906, ice shapes were measured by a stereo photography system.
NASA TM 83564:
Conclusions
Icing can be characterized with respect to those conditions that caused the ice accretions including
(1) the basic icing cloud variables such as liquid water content, droplet size distributions, volume median diameter, temperature, and extent of the icing cloud and
(2) the properties of the ice accretions such as ice type, shape, icing rate, and reference total accretion.
Aircraft performance can then be associated with these parameters or displayed with more familiar criteria such as FAR 25 appendix C icing certification requirements.Glaze icing, which generally occurs at total air temperatures just below freezing, results in rough, irregular ice formations with flat or concave surfaces facing the airstream. This type of icing generally causes the largest aircraft performance penalties in terms of loss in aircraft lift, and increase in aircraft drag. Depending on icing rates under these conditions, aircraft drag can increase measurably in relatively short periods of time (less than 30 min) with attendant losses in climb rate and/or engine out capability. Aircraft with many non-deiceable components such as struts, landing gear, hinge brackets, antennae, and other small protuberances as are found Lewis icing research aircraft, can retain 50 - 60 percent of the total accumulated drag even after deicing the wing and tail group.
Rime icing which generally occurs at lower total air temperatures below freezing, results in smoother, more pointed ice formations facing the airstream. This type of icing generally causes much lower lift and drag penalties as compared to similar amounts of glaze ice. This result is illustrate by comparing a rime icing research flight (83-11) to a glaze icing research flight (83-10) where approximately the same LWC's were encountered at the same airspeeds. Even though Flight 83-11 encountered icing 77 percent longer than Flight 83-10, the drag increase for Flight 83-11 was only one-third as great as that measured on Flight 83-10.
NASA TM 86906:
Conclusions
- It has been shown that stereo photography can be used as a means to measure natural lce shape profiles in the flight environment.
- It has been shown that a wake survey probe can be used in flight to measure increases in wing section drag caused by natural ice.
- The time required for aerodynamic data acquisition must be reduced in order to minimize errors caused by ice sublimation and erosion.
- Glaze ice affects the performance of aircraft far more seriously than rime or mixed ice (i.e., combination of rime and glaze).
- Glaze ice can rapidly erode engine out capability if an ice protection system falls or does not protect a sufficient area of the aircraft in order to reduce enough of the drag increase caused by ice.
Ice Protection, "Thin, lightweight, electrothermal ice protection-New technology supplementing existing ice protection" 3
Abstract
Ice formations caused by impingement of large drizzle droplets and/or runback ice occurring at temperatures near freezing aft of the normal ice protected aircraft surfaces have resulted in serious aerodynamic and control surfaces performance losses. A solution to these problems is a new supplemental ice protection installed beyond the existing protected areas. This retrofit installation is easily achieved by a new, lightweight, and efficient electrothermal deicing system consisting of a conductive matrix laminate bonded to any surface using standard aircraft materials.
Recent icing wind tunnel test results reported herein have demonstrated that this new technology provides ice protection (deice or anti-ice) with very low power requirements compared to earlier electrothermal systems. A full scale wing with conventional pneumatic boots on the leading edge was equipped with the new electrothermal conductive matrix laminate bonded to the surface aft of the boots. It was also found necessary to prevent icing to extend the conductive matrix forward under the inactive rear portion of the pneumatic boot.
Conclusions
Perkins' career spanned the NACA and NASA eras. The instruments that he was familiar with (rotating multicylinder) and developed (the PIRAM) were used as late as 1986.
Citations
References were cited at scholar.google.com these many times:
NASA TM 83564: 28
NASA TM 86906: 31
AIAA-96-0391 : 3
Related
This is part of the Porter Perkins series.
The development of the PIRAM, led by Perkins, is detailed in NACA-RM-E51E16.
Perkins was a coauthor of NACA-TR-1215, "Impingement of Cloud Droplets and Procedure for Measuring Liquid-Water Content and Droplet Sizes in Supercooled Clouds by Rotating Multicylinder Method"
The "Frequency of occurrence" calculations for these flights are rather complex, and are detailed in Reproducing NACA-TN-2738 calculations.
Notes
-
Ranaudo, R. ,J.; Mikkelsen, K. L.; McKnight, R. C. and Perkins, P. J. Jr., "Performance Degradation of a Typical Twin Engine Commuter Type Aircraft in Measured Natural Icing Conditions," NASA TM 83564 and AIAA-84-0179, 1984. ntrs.nasa.gov ↩↩
-
Mikkelsen, K. L., McKnight, R. C., Ranaudo, R. J. and Perkins, P. J. Jr., "Icing Flight Research: Aerodynamic Effects of Ice and Ice Shape Documentation with Stereo Photography," NASA TM 86906 or AIAA-85-0468, 1985. ntrs.nasa.gov ↩
-
Perkins, P., Otis Hastings, and William Rieke. "Thin, lightweight, electrothermal ice protection-New technology supplementing existing ice protection." 34th Aerospace Sciences Meeting and Exhibit, AIAA-96-0391. 1996. arc.aiaa.org ↩
-
Ide, R., et al. "The measurement of aircraft performance and stability and control after flight through natural icing conditions." 3rd Flight Testing Conference and Technical Display. NASA TM 87265 or AIAA-86-9758, 1986. ntrs.nasa.gov ↩