"A Probability Analysis of the Meteorological Factors Conducive to Aircraft Icing in the United States"
"the probability analysis presented does provide an indication, heretofore unavailable, of the combinations of icing conditions having equal probability"
Summary
The icing design values in NACA-TN-1855 were found to have an exceedance probability Pe=0.001.
Key Points
- A rigorous probability analysis of the considerable icing flight test data was conducted.
- The icing design values in NACA-TN-1855 were found to have an exceedance probability Pe=0.001.
Abstract
Meteorological icing data obtained in flight in the United States are analyzed statistically and methods are developed for the determination of:
(1) the various simultaneous combinations of the three basic icing parameters (liquid-water content, drop diameter, and temperature) which would have equal probability of being exceeded in flight in any random icing encounter; and
(2) the probability of exceeding any specified group of values of liquid-water content associated simultaneously with temperature and drop-diameter values lying within specified ranges.
The methods are particularly useful in the design of anti-icing equipment intended to operate through the United States, to define simultaneous combinations of the meteorological variables which could be encountered, and to ascertain the effectiveness of the equipment in withstanding the natural icing conditions to which it may be subjected. In addition, a mathematical basis is provided for the future statistical analysis of meteorological icing data that might be obtained throughout the world.
Discussion
This report is extensive (94 pages), so many details are not covered herein.
INTRODUCTION
The program of research in aircraft ice prevention which has been conducted by the NACA during the past several years has been directed primarily toward the development of practical methods for the design of thermal ice-prevention equipment for various airplane components. Since a rational ice-prevention design requires a knowledge of the physical characteristics of icing conditions, an important phase of the research program has been an investigation of the meteorological conditions conducive to icing.
The severity of an encounter with icing, conditions is determined principally by four factors; namely, the liquid-water content, the diameter of the drops, the temperature, and the horizontal extent of the conditions. The meteorological investigation has, therefore, been concerned with obtaining measurements of these quantities in a wide variety of natural icing conditions in order to establish the range and relative frequency of occurrence of various values, and combinations of values, of these quantities.
During the period 1945 through 1948, a considerable amount of data was collected by the Ames and Lewis Laboratories. These results, and discussions of various phases of the investigation, have been reported in references 1 through 4. All of these results, together with similar data from observations made by other organizations, were used as a basis for a listing of estimated maximum icing conditions recommended for consideration in the design of anti-icing equipment (reference 5). The probable maximum values listed in reference 5 were estimated on the basis of what was considered a reasonable extrapolation from a limited amount of data, and the concept of the probability of encountering various simultaneous combinations of values entered only in a subjective and qualitative way.
[Emphasis added.]
Reference 1 is NACA-TN-1393.
Reference 2 is NACA-TN-1424.
Reference 3 is NACA-TN-1904.
Reference 4 is NACA-TN-1793.
Reference 5 is NACA-TN-1855.
In this report, the available data obtained in icing flights in the United States are analyzed statistically and the results are presented graphically in two forms.
In the first form, the results are plotted to show the various combinations of liquid-water content, drop diameter, and ambient-air temperature which have equal probability of being exceeded.
In the second form, plots are presented to determine the probability of exceeding any specified value of liquid-water content under the condition that the value is associated simultaneously with values of temperature and drop diameter lying within specified intervals.
Both plots are based on preselected values of horizontal extent; however, methods for estimating values applicable to other horizontal extents are also presented.
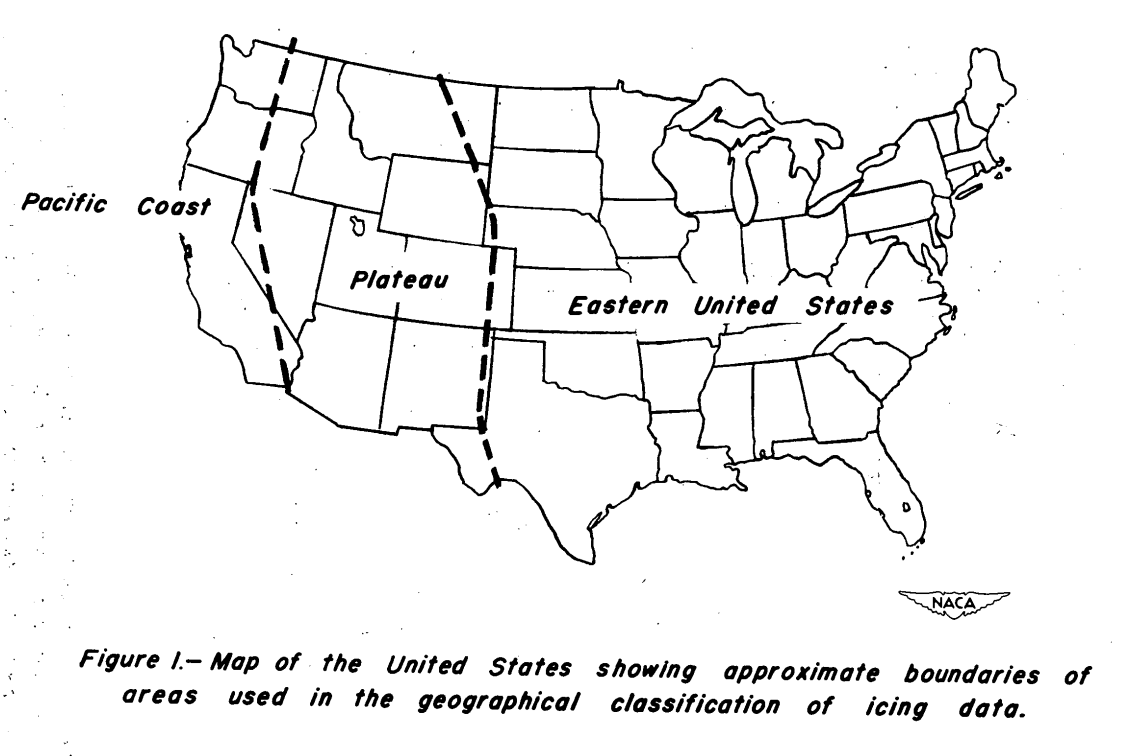
Data were divided by geographical region.
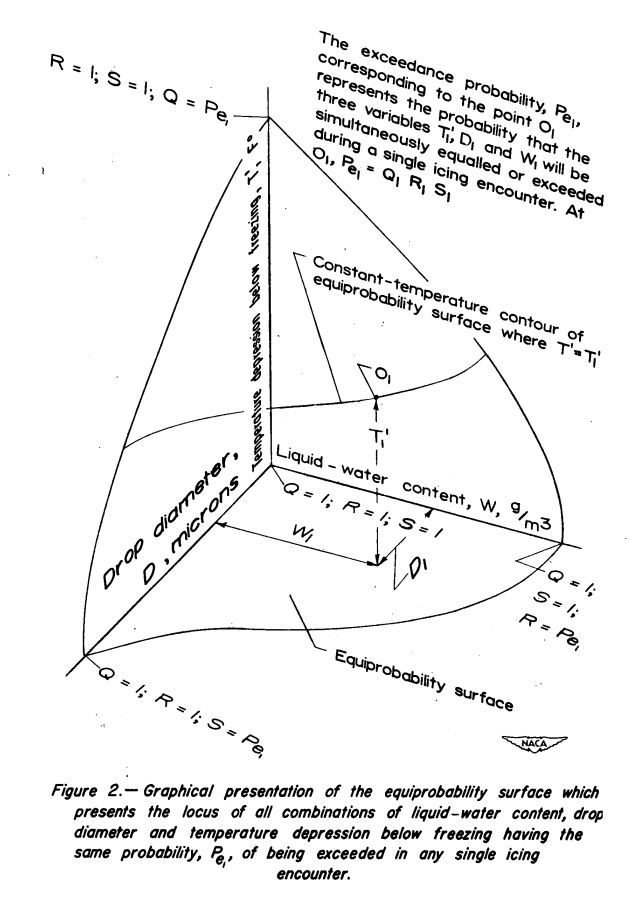
Construction of the equiprobability surfaces.
The procedure used in the construction of equiprobability surfaces ... is illustrated in appendix A.
Appendix A describes in detail the calculations illustrated in Figure 2.
The mathematical functions used to represent the various distributions were chosen mainly on the basis of the empirical criterion of goodness of fit, although theoretical considerations also were given considerable weight, particularly in the selection of a function to represent the distribution of maximum values in those cases in which each item in the distribution is the maximum of a group of observed values. The function chosen for representing such distributions is one originated by Dr. E. J. Gumbel (reference 11) to describe a distribution of extreme values. This function will be referred to hereinafter as "Gumbel's distribution."
Using this method comparisons were made to the values in NACA-TN-1855.
Comparison of Results of the Equiprobability Analysis With Results of NACA TN 1855
Certain values of liquid-water content, drop diameter, and temperature were presented in NACA TN 1855 (reference 5) for consideration in the design of anti-icing equipment. The combinations of meteorological variables recommended, however, were lacking in one respect, namely, the probability of occurrence of these particular combinations. Fortunately, with the aid of the equiprobability curves, some indication of these probabilities can be obtained when corresponding meteorological conditions are compared.
Four classes of icing conditions are presented in NACA TN 1855: I, instantaneous; II intermittent; III, continuous; and IV, freezing rain. All classes, except IV, are subdivided into two types of icing conditions, maximum and normal, and are confined to icing conditions associated with definite cloud formations of characteristic horizontal extents. Hence, classes I, II, and III are ideal for comparison with the results which can be obtained from the equiprobability charts (figs. 3 to 7) and the relations for horizontal extent (fig. 8).
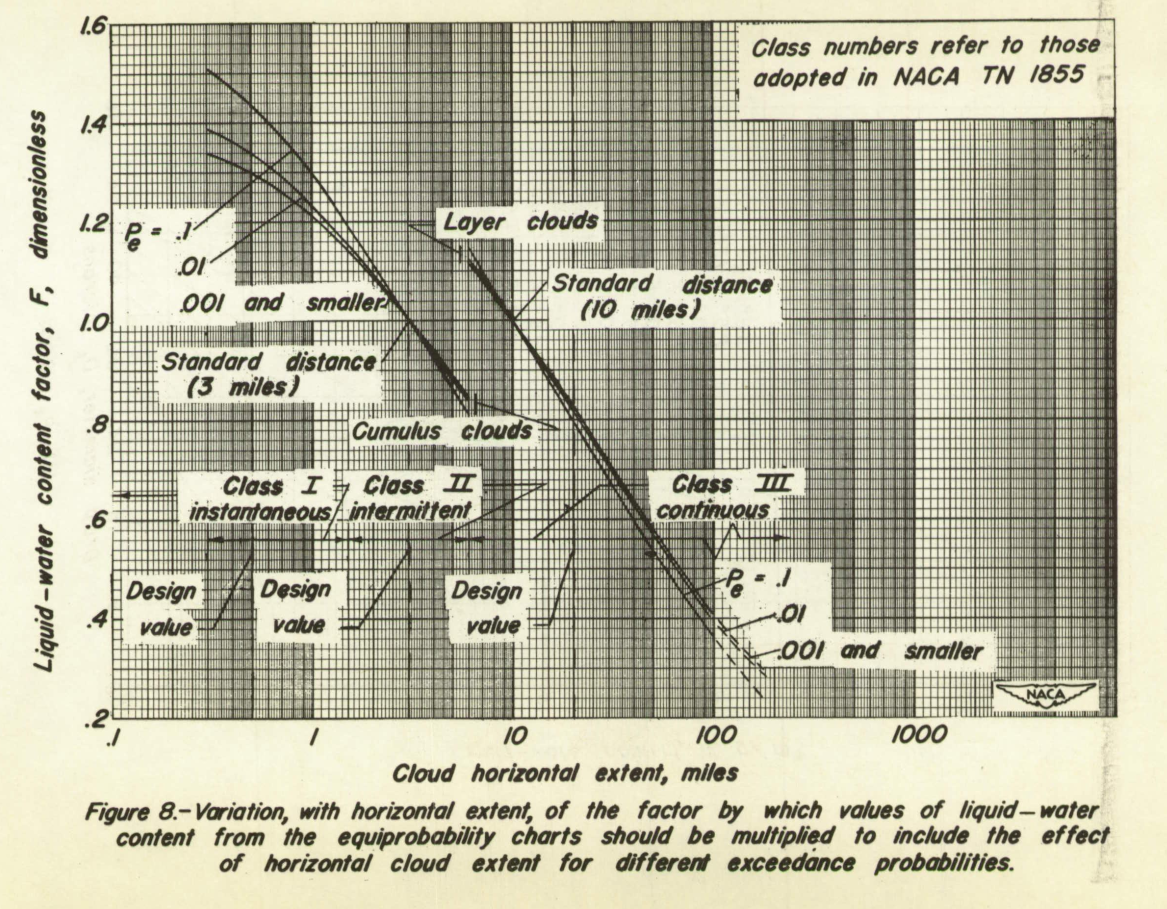
Note that the "Liquid Water Content Factor, F" is 1 at 10 miles for layer clouds.
How the values in Figure 8 were determined is not described. The other factors key (LWC, drops size, temperature) have figures 11 through 26 that describe them in detail, but the "Liquid Water Content Factor, F" is not detailed.
Appendix C has a similar figure 3. However, the "Liquid Water Content Factor, F"
is equal to 1 at 17.4 nmi (20 miles). Note that NACA-TN-2738 is cited on figure 3.

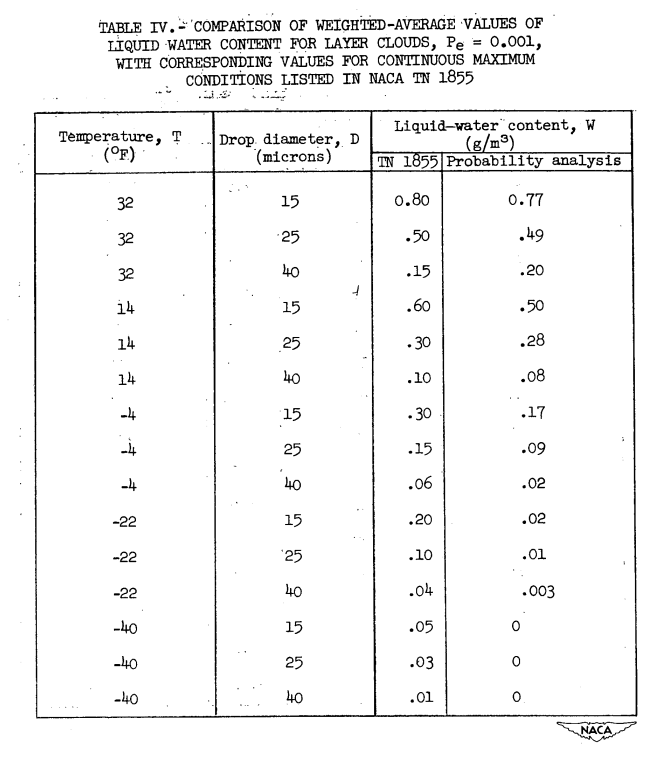
Two groups of icing conditions are chosen as a basis for comparison between the analysis of this report and NACA TN 185. The first group consists of icing conditions selected from the probability analysis for the case of layer-type clouds, with an exceed.ance probability Of Pe = 0.001. The second group consists of icing conditions for the case of Pacific coast cumulus, also with an exceedance probability of 0.001. These two groups are compared, respectively, with classes Ill-N and II-M from NACA TN 1855. The comparisons are made by determining values of liquid-water content from figure 4 and figures 3, 5, and 7 for the various combinations of temperature and drop diameter given in table I of NACA TN 1855 for class II-M and III-M conditions, respectively. The three values of liquid-water content obtained from figures 3, 5, and 7 corresponding to class III-M were averaged by weighting the values according to the horizontal extent of the region to which they apply.
The three regions (fig. 1) have area ratios of about 1/8, 2/8, and 5/8 for the Pacific coast, plateau, and eastern regions, respectively; and these area ratios were used to weight the values of liquid-water content from the equiprobability charts so that the resulting average values would be on a comparable basis with the values expressed In NACA TN 1855. The weighted average values of liquid-water content were corrected by figure 8 to make them applicable to a horizontal extent of 20 miles, a figure reasonably applicable to the layer-cloud data of NACA TN 1855. For class II-M conditions, no correction for horizontal extent was required because the values in NACA TN 1855 and figure 4 both apply to 3 miles horizontal-cloud extent.
The results of the comparisons between NACA TN 1855 and the probability analysis are shown in tables III and IV for classes II-M and III-M, respectively. In general, the liquid-water-content values agree quite closely, except at temperatures of -4 F and below. In this low temperature range, the values of liquid-water content derived from the equiprobability surfaces are considerably lower than values given in NACA TN 1855. The reason is that the probability analysis entails some extrapolation in this temperature range, and so may not provide exactly the correct value of liquid-water content. On the other hand, the values listed in NACA TN 1855 are not restricted to actual measurements, and therefore may not be of precise magnitude. For design purposes, however, the values given by the probability analysis should be of proper magnitude. In this regard, it should be noted that the majority of the data utilized in the probability analysis was taken at comparatively low altitude (13,000 feet), whereas the temperature range between -4 F and -40 F represents considerably higher altitudes (18,000 to 28,000 feet). This difference In altitude could have some bearing on the accuracy of the probability data, particularly at very high altitudes.
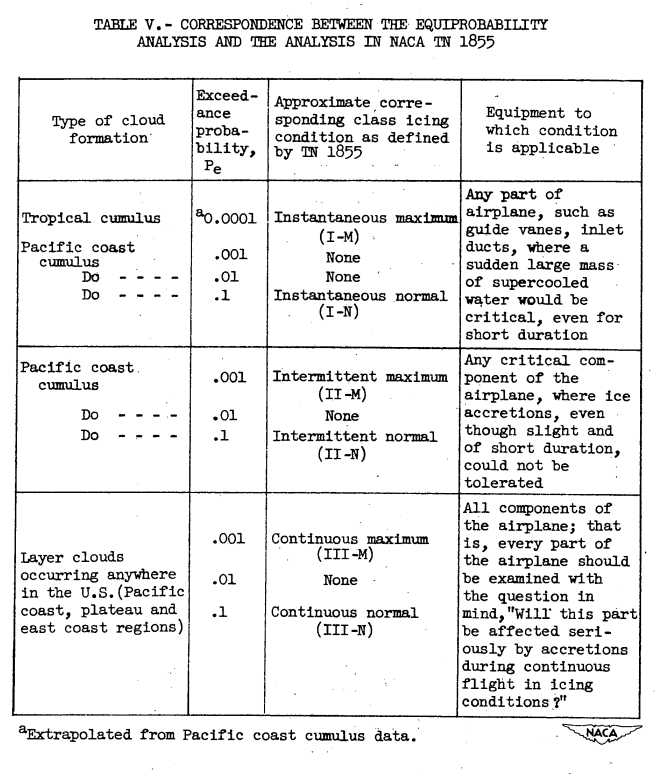
By a procedure similar to that used in the comparisons for the two example cases, the correspondence between classes of Icing conditions represented by the equiprobability charts and other classes of conditions presented in NACA TN 185 could be ascertained approximately. The correspondence for these classes of conditions, and also for the two example cases, are shown in table V.
An inspection of table V reveals a consistency between the classes of design values recommended in NACA TN 1855 and specific values of exceedance probabilities. Only the instantaneous maximum icing condition (Pe = 0.0001) appears to be incongruous with the maximum conditions in classes II-M and III-M (Pe = 0.001). This apparent incongruity is directly attributable to the fact that the instantaneous maximum condition presented in NACA TN 1855 was calculated for tall tropical cumulus clouds. Such extremely severe icing conditions would, of course, be exceeded infrequently as is borne out by the probability analysis. Another point of interest in regard to table V Is the general order of magnitude of the exceedance probabilities which are found to apply to the various classes of icing conditions specified in NACA TN 1855. For example, any one of the icing conditions listed under class II-M (intermittent maximum) or class III-M (continuous maximum) will be exceeded once in only about a thousand encounters with icing conditions. It is believed that the icing conditions specified by classes II-M and III-M do not impose too severe design requirements and, therefore, if the ice-prevention system will cope with these conditions, the results of the probability analysis indicate that satisfactory ice protection would be provided for the vast majority of icing encounters.
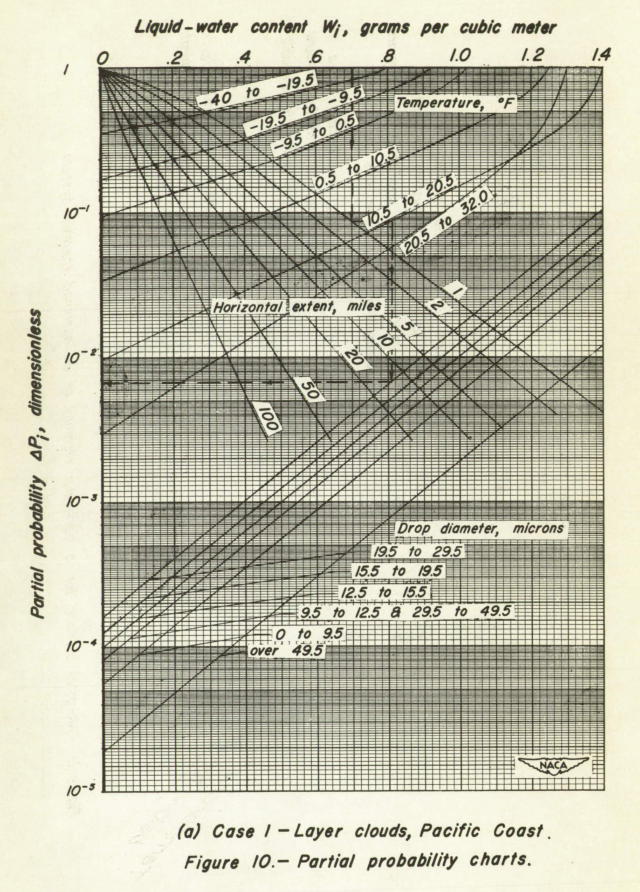
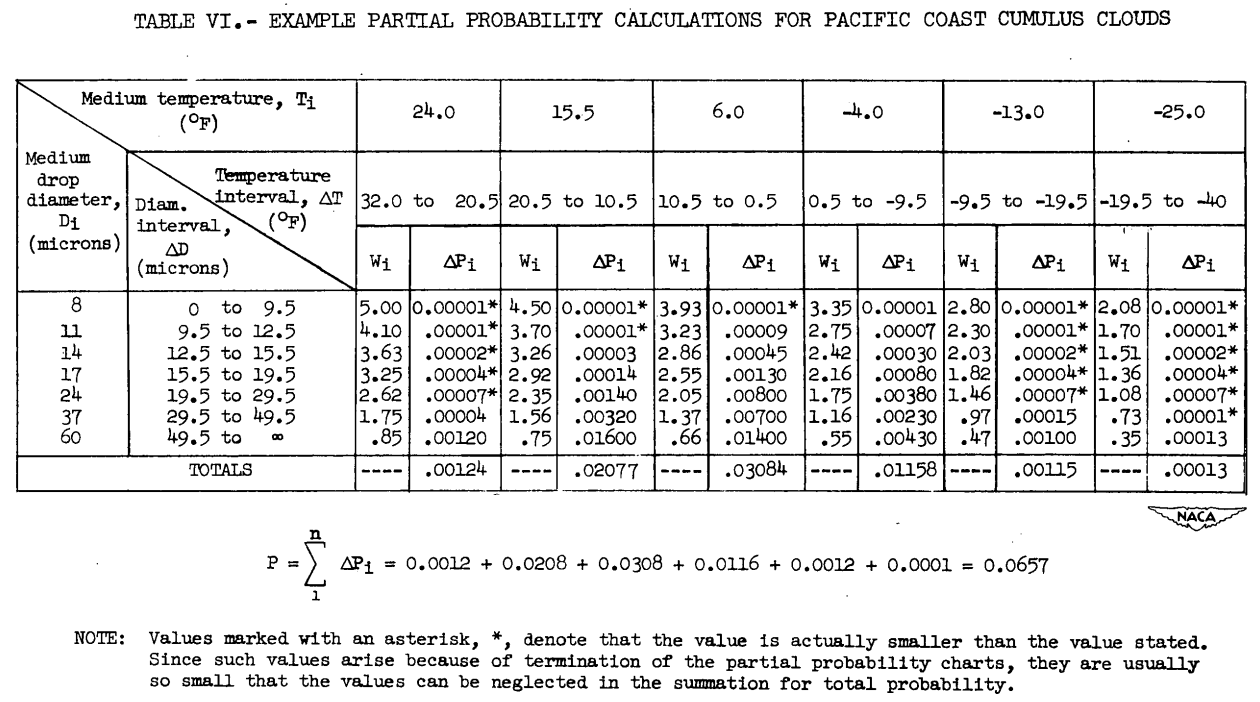
The Partial Probability Charts
The partial probability charts essentially provide a rapid means of determining the approximate probability of exceeding any specified group of values of liquid-water content associated simultaneously with temperature and drop-diameter values lying within specified ranges. Thus, if an anti-icing component (e.g., unit span of a jet-inlet guide vane) is designed by the method of reference 16 to withstand a constant values of weight rate of water-drop impingement Mt, as computed from a particular set of values of liquid-water content, temperature, and drop diameter, and if other combinations of these same variables are found which correspond to the same weight rate of drop impingement, then the probability of encountering conditions under which the component will not perform satisfactorily can be determined approximately. The calculation of this probability can be performed with the aid of the partial probability charts (fig. 10).
Conclusions
CONCLUDING REMARKS
The equiprobability surfaces and marginal probability calculation charts presented herein provide, for the United States, a representation of the data now available on the meteorological factors responsible for aircraft icing, expressed In terms of the probability of exceeding various combinations of values of these factors. The usefulness of the results is limited somewhat by the amount of data available; errors of measurement, especially at large values of drop diameter; nonrepresentativeness of the flight procedures during research flights; and limited altitude and geographical extent of the research flight program. In spite of these limitations, the probability analysis presented does provide an indication, heretofore unavailable, of the combinations of icing conditions having equal probability of being exceeded in the United States, and also the probability of exceeding a special set of icing conditions. Also, a procedure has been established for the statistical analysis of future icing meteorological data obtained on a world-wide basis.
[Emphasis added.]
The methods are quite tedious to use. They are also quite tedious to implement in a program. I doubt that the methods have been used much. I perused the 38 citations of NACA-TN-2738 and I did not find one that used the calculation method, they do cite the results and conclusions.
The enduring part of NACA-TN-2738 is the confirmation that the sometimes "qualitative" or estimated parts of the icing values in NACA-TN-1855 represent something close to a more rigorously determined equiprobability surface with Pe=0.001.
Jeck 2 comments about NACA-TN-2738 ([5] in Jeck):
Although the original data collection flights were only in winter and spring icing conditions over parts of the United States, the existing curves appear to represent all-season stratiform and convective icing conditions (excluding freezing rain and freezing drizzle) for the United States and Europe. They enclose about 99% of all measurements obtained by the research flights of the 1940s [12]. A mathematical evaluation in 1952 [5] showed that this “was roughly equivalent to a probability of 1/1000 that all three variables (LWC, MVD, and OAT) represented by a single point (in figure 1) would be exceeded simultaneously.” The LWC curves themselves, however, are thought to represent the 99th percentile value of LWC for a given MVD and OAT. No other evaluations of the envelopes have since been published.
Citations
NACA-TN-2738 is one of the three NACA publications cited directly in Appendix C of the FAA icing regulations, part 25 3.
An online search (scholar.google.com) found 38 citations for NACA-TN-2738.
Notes
-
Lewis, William, and Bergrun, Norman R.: A Probability Analysis of the Meteorological Factors Conducive to Aircraft Icing in the United States. NACA-TN-2738, 1952. ntrs.nasa.gov ↩
-
Jeck, Richard K. "Advances in the characterization of supercooled clouds for aircraft icing applications". No. DOT-FAA-AR 07-4. Office of Aviation Research and Development, Federal Aviation Administration, 2008. tc.faa.gov ↩