Articles with tag: "Probability"

(Note: figures do not appear in the summaries below)
  1. Conclusions of the Series on Dr. Jeck

    "... to illustrate the possibilities" 1

    Figure 25d.
    Public Domain image from DOT/FAA/AR-00/30.

    Introduction

    Dr. Jeck was described as "A gifted physicist and innovator" 2. We have seen several examples in this series. Several of his proposals have been adopted, while others are still open possibilities.

    Dr. Jeck's own summaries

    Here are selected conclusions from three of Dr. Jeck's later works:

    "Icing Design Envelopes (14 CFR Parts 25 and 29, Appendix C) Converted to a Distance-Based Format 1:

    The methods illustrated here provide the icing practitioner with straightforward, understandable, and meaningful ways to document, compare, and evaluate data on icing conditions. They offer a set of working standards for achieving consistency and uniformity among users. Some methods may be more useful than others, depending on the application, but a variety are offered, with examples, to illustrate the possibilities.
    The example graphs also illustrate the use of computerized spreadsheet software for …

    read more
  2. Using the Supercooled Cloud Database

    "The confidence in the curves is strongest where the data points are plentiful."1

    jeck reproduce fig 22.

    Introduction

    With over 6,000 measurements and 28,000 nmi of natural icing flight test data, there are many analyses that can be performed.

    Here, I will attempt to reproduce some of the Natural Probability curves.

    Files provided for the SCDB

    I will refer to Dr. Jeck's published values as the Supercooled Cloud Database or SCDB.

    The database files I received I will refer to at the spreadsheet or spreadsheets.

    There are area where they are not exactly the same, as will be shown below.

    I requested a copy of the SCDB from the FAA, and was provided with a copy. It came as two spreadsheet files, "Convective Cloud Icing Events_original.xls" and "Layer Cloud Icing Events_original.xls". There is only one sheet per file, and no macros, so these are essentially rows and columns of …

    read more
  3. Working with Natural Probabilities

    "A number of potential uses are illustrated for the new format, particularly for comparing icing test exposures to ... natural probabilities of occurrence."

    Figure 23.
    Public Domain image from DOT/FAA/AR-00/30. 1

    Introduction

    In DOT/FAA/AR-00/30 1 Dr. Jeck wrote of Figure 23:

    3.2 COMPARING WITH NATURAL LWC PROBABILITIES.
    ...
    Figure 23 shows a set of LWC probability curves derived from about 23,000 nmi of flight data in stratiform icing conditions. Any given curve indicates the probability that randomly encountered, stratiform icing conditions will have an average LWC somewhere below the curve. For example, the 50% curve means that half of the LWC averages will lie below the curve and half will lie above it. The 90% curve means that 90% of all LWC averages can be expected to lie below it, for any given averaging distance, or horizontal extent.

    The sample LWC trace has been plotted on …

    read more
  4. Natural Probabilities

    "what is the probability of finding such a test exposure in nature?"

    Figure 23.
    Public Domain figure from DOT/FAA/AR-00/30.

    Introduction

    A 28,000 nmi database is large enough to calculate meaningful probabilities, which Dr. Jeck termed Natural Probabilities.

    He also used the data to make the remarkable proposal of replacing the figures in Appendix C with distance and probability based ones. While this has not yet been adopted, some of his proposals have been adopted as supplements.

    Natural LWC Probabilities

    Dr. Jeck introduces the term "Natural LWC Probabilities" in the context of discussing analysis of flight test data in DOT/FAA/AR-00/30 1:

    3.2 COMPARING WITH NATURAL LWC PROBABILITIES.

    One comparison that is not possible with Appendix C is the question of how common, or uncommon, was a particular test flight icing encounter? Or, how representative of nature is a particular icing wind tunnel exposure or computer …

    read more
  5. Origins of The Supercooled Cloud Database

    "Thanks are also due ... for their patience and support on this long project." 1

    Figure 22.
    Public Domain image from DOT/FAA/AR-07/4.

    Introduction

    There are 28000 nmi of measured natural icing flight test data in the database, with over 6000 individual measurements. Data from more than two dozen organizations for flights between 1946 and 1988 (42 years) were collected into the database.

    Dr. Richard Jeck of the FAA was the lead in assembling the database.

    Dr. Jeck used the term "Supercooled Cloud Database", so here we will abbreviate that to Database or SCDB.

    The database took at least 14 years to assemble.

    Early Motivations for the Database

    Nearly of the database (14,372 nmi out of 28,000) of the Database already existed before Dr. Jeck started: The inflight icing data from the NACA-era. That data was the basis of the current Appendix C icing environment definitions. See Conclusions of …

    read more
  6. 28,000 Miles of Data: The Publications of Dr. Richard Jeck

    "a number of advantages and uses of this new, distance-based format"

    figure12.png
    Public Domain figure from DOT/FAA/AR-00/30.

    Dr. Richard Jeck 1, retired from the FAA, passed away in January 2026 2.

    Dr. Jeck had over 60 publications in the area of aircraft icing 3. Many of them have been cited numerous times, and are currently cited in 2026.

    I knew Dr. Jeck professionally through industry organizations (AIAA, SAE) and meetings with the FAA.

    I had the opportunity to have a drink with him one evening circa 1993 at an AIAA meeting. He was generous with his time to a junior engineer.

    He was uniquely gifted in translating meteorological data into terms that could be understood and used by the diverse communities within aircraft icing (meteorologists, researchers, regulators, industry, pilots, academia, and others).

    Here we will review and celebrate some of his numerous technical publications.

    His obituary notes him …

    read more
  7. Porter Perkins Flight Safety Publications

    "Most, if not all of the recent accidents on record having icing as the probable cause could have been prevented if the flight crews understood the serious nature of the situation and had applied appropriate corrective action." 2

    Summary

    Three publications on flight safety by Porter Perkins are reviewed.

    Discussion

    These publications are copyrighted. The first one, however, has a reuse license, and so much of the discussion will center on it.

    "Tailplane icing and aircraft performance degradation" 1992 1

    Ice on the tailplane (horizontal stabilizer) was identified as a risk on some aircraft:

    Although the sensitivity of airplanes to inflight icing has been recognized for many years and can be minimized by ice protection systems, the advent of the medium-altitude turboprop commuter transport aircraft has resulted in renewed attention to the icing problem. This review of icing has been prompted by several recent accidents that apparently were caused by …

    read more
  8. Reproducing NACA-TN-2738 Calculations

    "In view of the number and complexity of the possible sources of error, it is not possible at this time to make a reliable estimate of the total accuracy" 3

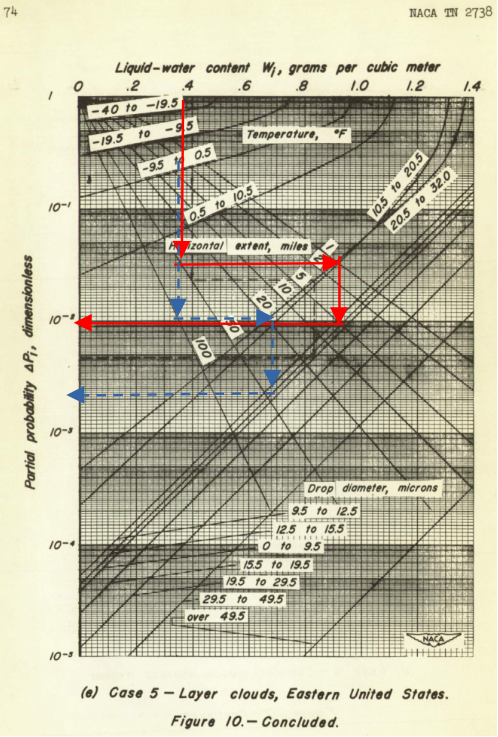
    8-39 figure 10e. Calculations for Flight 8-39.

    Summary

    Calculations are made to assess the probability of encountering certain icing conditions.

    Introduction

    In Porter Perkins Ice Shapes and Ice Protection, references NASA TM 83564 1 and NASA TM 86906 2, the probability of encountering certain icing conditions was assessed, using methods from NACA-TN-2738 3. Here, we will attempt to reproduce those calculations.

    Discussion

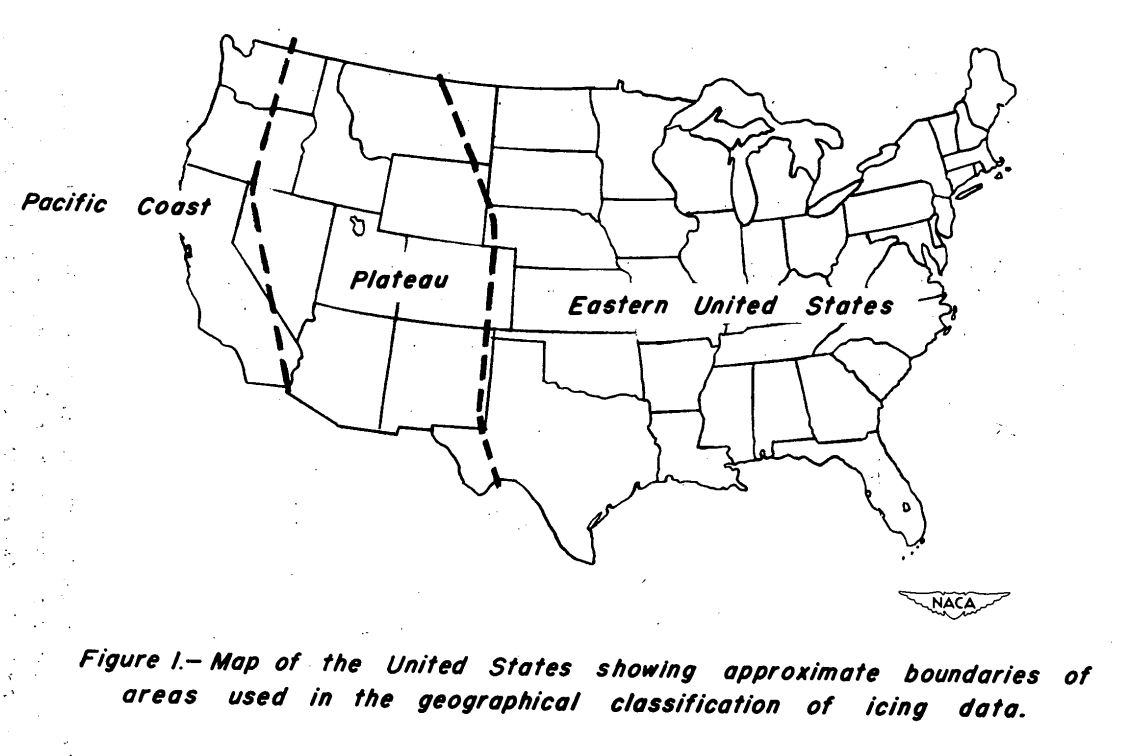
    In NACA-TN-2738, data were divided by geographical region.

    Figure 1. Map of the United States showing approximate 
boundaries of areas used in the geographical classifications 
of icing data.

    The NASA Technical Memos did not state where the natural icing test flights were. However, as three of the authors were based out of the NASA Lewis Research Center, Cleveland, Ohio, I will assume that the flights operated out of there and were in the Eastern United States region.

    So, the appropriate chart to use is Figure …

    read more
  9. Porter Perkins

    "As the demand for all-weather protection on aircraft for unimpaired and continuous commercial and military service developed, the detrimental effects of ... icing on airplane performance became increasingly important" (1948)

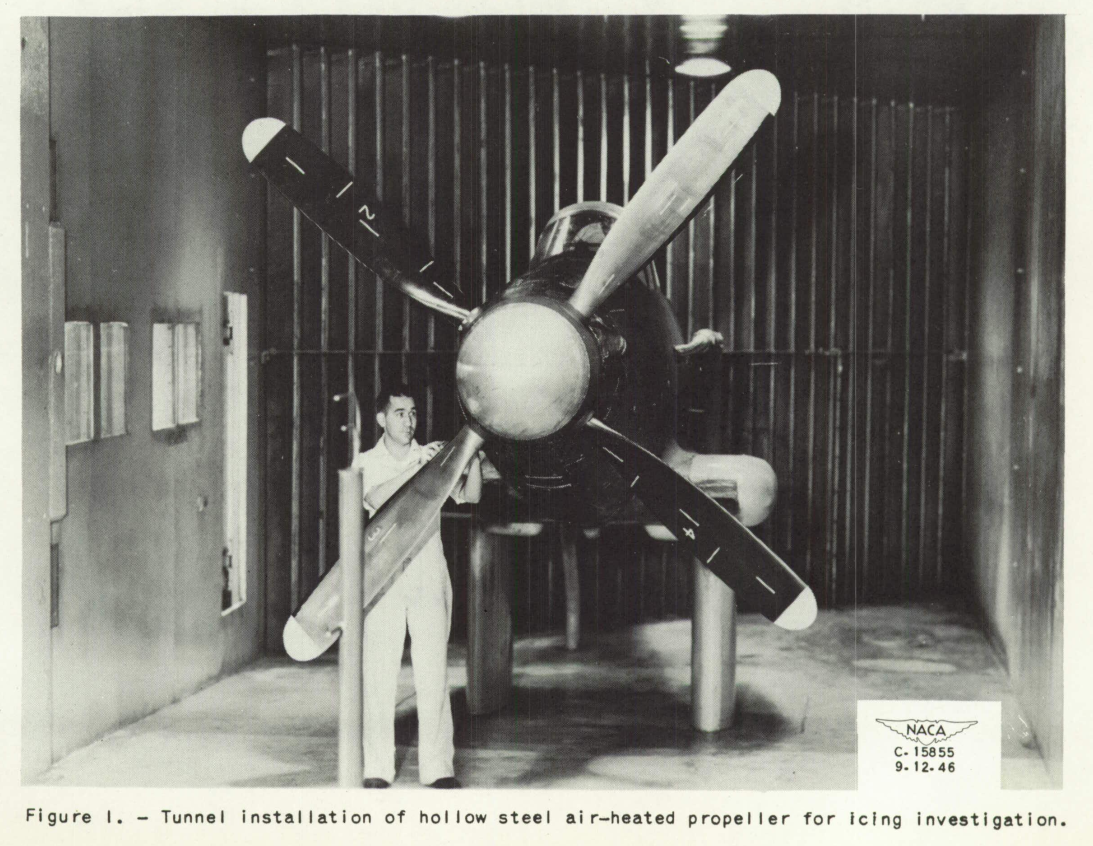
    Figure 1. Tunnel installation of hollow steel air-heated propeller for icing investigation. A tall, lean man with a distinctively tall nose inspects the propeller.

    From NACA-TN-1586. I believe that this is Porter Perkins, circa 1946.

    Summary

    Porter Perkins published on icing topics for over 50 years while at NACA, NASA, and other groups.

    Biographies and Memorials

    Porter J. Perkins is a senior aerospace engineer working in aviation safety as manager of airworthiness of research flight activity at the Lewis Research Center of the U.S. National Aeronautics and Space Administration (NASA), Cleveland, Ohio, U.S. He has specialized in research on aircraft icing for more than 25 years. His in-flight measurements to characterize icing clouds were later incorporated into U.S. icing protection certification standards. He has authored or co-authored more than 25 reports in the field of aircraft icing, and continues to participate in …

    read more