"The results showed that glaze-ice formations, either primary or runback, ... caused large and rapid increases in drag, especially at datum air temperatures approaching 32F"
NACA-TN-2962, "Effect of Ice and Frost Formations on Drag of NACA 651-212 Airfoil for Various Modes of Thermal Ice Protection" 1
Summary
The drag due to ice shapes (including runback) are measured over a range of conditions.
Key Points
- "The results showed that glaze-ice formations, either primary or runback, ... caused large and rapid increases in drag, especially at datum air temperatures approaching 32F"
- There is an early statement of icing wind tunnel test to flight similarity.
- Different phases of flight (takeoff, cruise, descent), including sequences, are considered.
- By "discriminating use of the data", drag results can be estimated using NACA-TR-446.
Abstract
The effects of primary and runback icing and frost formations on the drag of an 8-foot-chord NACA 651-212 airfoil section were investigated over a range of angles of attack from 2° to 8° and airspeeds up to 260 miles per hour for icing conditions with liquid-water contents ranging from 0.25 to 1.4 grams per cubic meter and datum air temperatures of -30 to 30 F.
The results showed that glaze-ice formations, either primary or runback, on the upper surface near the leading edge of the airfoi1 caused large and rapid increases in drag, especially at datum air temperatures approaching 32° F and in the presence of high rates of water catch. Ice formations at lower temperatures (rime ice) did not appreciably increase the drag coefficient over the initial (standard roughness) drag coefficient. Cyclic de-icing of the primary Ice formations on the airfoil leading-edge section permitted the drag coefficient to return almost to the bare airfoil drag value. Runback icing on the lower surface did not present a serious drag problem except when heavy spanwise ridges of runback ice occurred aft of the heatable area. Frost formations caused rapid and large increases in drag with incipient stalling of the airfoil.
Discussion
This is a relatively long (69 page) publication. In the interest of brevity, and to leave room for the extensive "Significance of Results" section, I will not detail all of its points, particularly about deicing system design. Readers are encouraged to read the full publication, available at ntrs.nasa.gov.
The results presented herein were obtained with an 8-foot-chord NACA 651-212 airfoil model employing a hot-gas icing-protection system (ref. 2). The airfoil study was conducted over the following range of icing and operating conditions:
Angle of attack, deg ....................      2 to 8
Airspeed, mph ...........................  100 to 260
Liquid-water content, g/cu m ............ 0.25 to 1.4
Datum air temperature, °F ...............   -30 to 30
Mean effective droplet size, microns ....    10 to 16
APPARATUS AND INSTRUMENTATION
The model used in this study (and that of ref. 2) is an NACA 651-212 airfoil section of 8-foot chord spanning the 6-foot height of the Lewis icing research tunnel. The airfoil leading-edge section, consisting of three spanwise segments, may be gas-heated by means of chord-wise passages to 12 percent of chord. The center segment is 3 feet in span, and the top and bottom segments are 1.5 feet each in span (fig. 1). All segments were capable of being heated independently for cyclic ice removal or collectively for continuous heating. For the cyclic de-icing studies a continuously heated spanwise parting strip was used near the zero chord line (ref. 2).
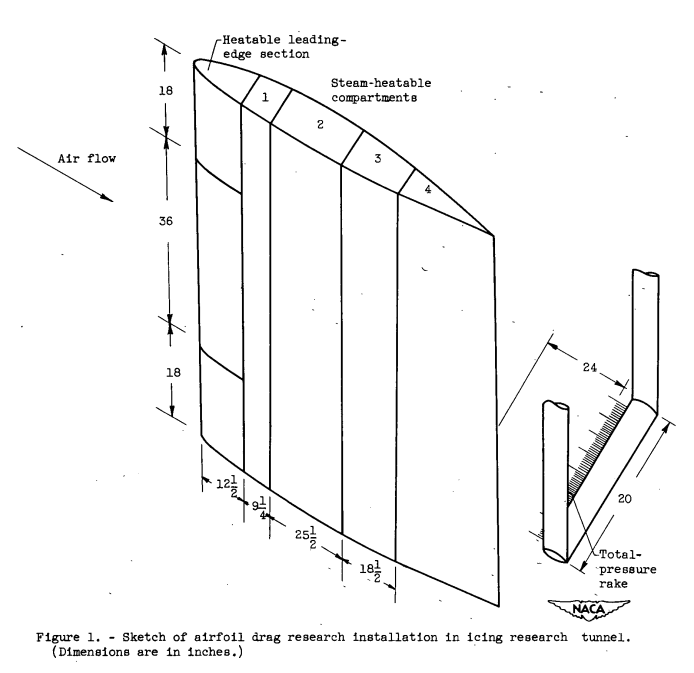
Aft of 12 percent of chord the model was divided into four compartments (fig. 1), each capable of being individually heated by means of steam. The inside of each compartment was lined with 1/16-inch-thick neoprene to reduce the surface temperature, which otherwise might have resulted in sufficient heat transfer to the airfoil wake to affect the drag measurements. In order to prevent steam leakage into the wake, these compartments (hereinafter designated afterbody) were operated under a slight vacuum.
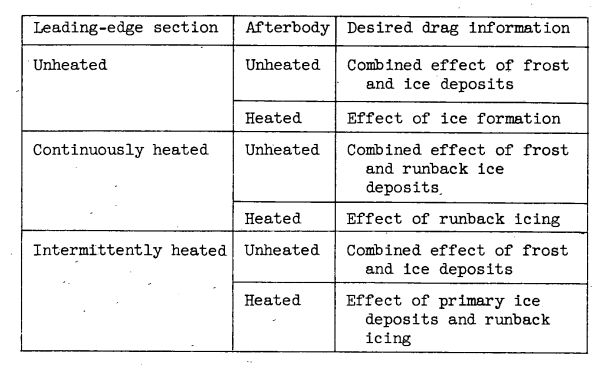
The heating was used in sets of configurations:
Datum air temperature was defined and determined as the average surface temperature of the unheated airfoil leading-edge section. In icing conditions, the datum temperature was determined from thermocouples that were shielded from or not subject to the fusion of impinged water. For the range of conditions investigated, little difference between datum and total air temperature was found. The icing conditions were determined from a previous.calibration of the tunnel and periodically checked with a pressure-type icing-rate meter (ref. 6). The mean effective droplet size in these studies ranged from 10 to 16 microns as determined from a dye-tracer technique.
The datum temperature here was experimentally determined. It may be similar to, but not exactly the same as, the analytically determined datum temperature in NACA-ARR-5G13. The dye-tracer technique for drop size is not elaborated on further. Perhaps it was the method later documented in NACA-TN-3338, "A Dye-Tracer Technique for Experimentally Obtaining Impingement Characteristics of Arbitrary Bodies and a Method for Determining Droplet Size Distribution" and NACA-TN-3839 (which were co-authored by von Glahn, a co-author on NACA-TN-2962).
Here we have an early statement of icing wind tunnel test to flight similarity considerations:
Because the tunnel airspeed was limited to 260 miles per hour, rates of icing and ice formations associated with higher speeds were obtained by increasing the liquid-water contents considerably above generally accepted values for natural icing clouds with the air temperatures used in the studies. In the absence of exact knowledge on droplet-impingement characteristics of the test airfoil, the data are discussed in general terms of water catch, defined in this investigation as a function only of liquid-water content and airspeed, rather than the more complex function requiring airfoil collection efficiency based on droplet size. By this means, the size of the ice formations obtained at airspeeds used in this investigation and at high liquid-water, contents may be assumed to be approximately representative of ice formations at twice the airspeed and half the liquid-water content.
For studies of the effect of afterbody frost formations on the drag of the airfoil, no heat was furnished to the afterbody. Frost formed on the afterbody because of air-stream turbulence and the supersaturated condition of the tunnel air. The studies with frost on the afterbody only were made over the same range of conditions as the icing studies. For studies in which the leading-edge section as well as the afterbody was coated with a frost formation, the tunnel air was refrigerated to -30° F, after which refrigeration was turned off and the ventilating doors of the tunnel were opened to permit warm moist air to pass over the cold model. Moisture condensing on the model from this warmer air soon covered the model with a fine coat of frost. Drag measurements with the pressure rake were made throughout the test. The frost studies with a fully frosted airfoil were made at an angle of attack of 8° and at a speed of about 100 miles per hour, simulating take-off conditions.
The statement "supersaturated condition of the tunnel air" was not elaborated on, it is not clear if it was measured, inferred, or assumed. (We may study this further in the Water Drop Evaporation thread).
RESULTS AND DISCUSSION
The investigation of the airfoil drag studies reported herein is divided into two primary categories. The first category is concerned with the increase in drag caused by ice formations associated with various modes of supplying heat to the leading-edge section; and the second, with an evaluation of the effect on airfoil drag of frost formations with and without accompanying ice formations. Tunnel wall interference effects were not evaluated.
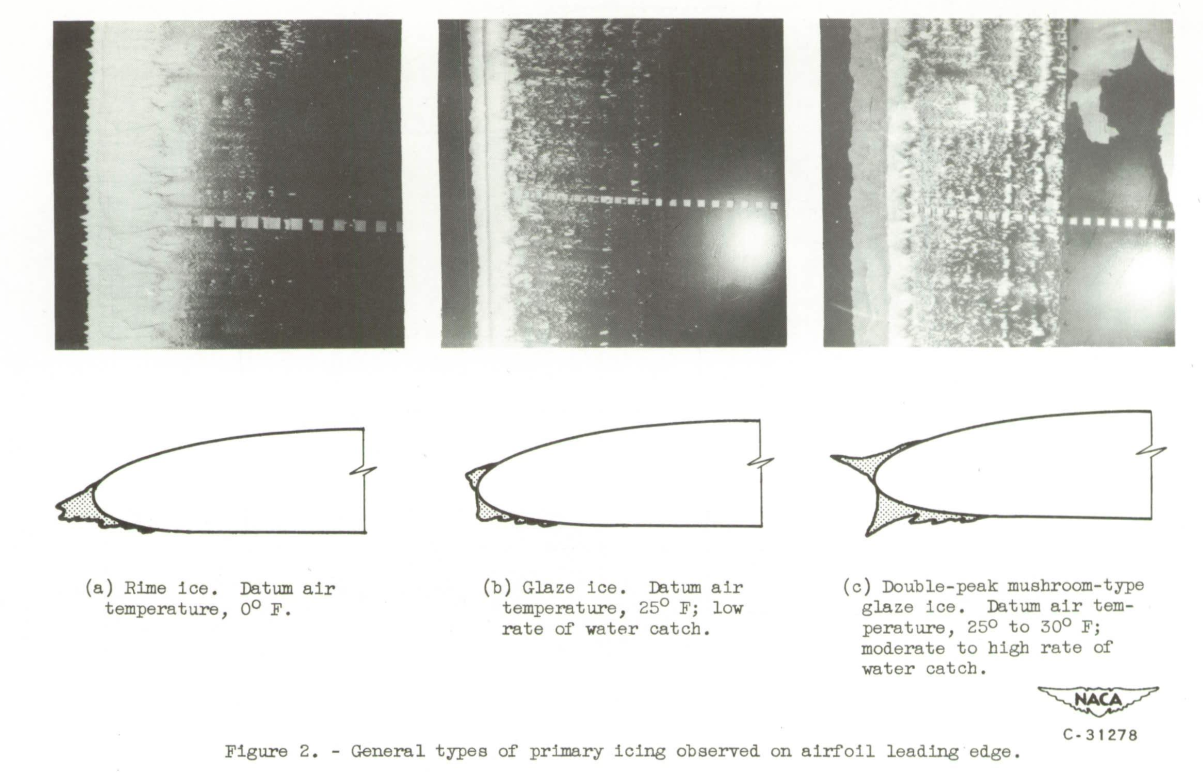
Three general types of leading-edge ice formations were investigated (fig. 2). The first, a rime-ice formation (fig. 2(a)), was associated with a datum air temperature of 0 F and was essentially independent of liquid-water content. These ice formations conformed closely to the airfoil contour and faired generally forward into the air stream. The second type, a glaze-ice formation (fig. 2(b)), was obtained with a datum air temperature of approximately 25F and relatively low rates of water catch. These ice formations generally built outward at an angle to the air stream, but the primary ice formation was still somewhat faired into the airfoil contour and did not penetrate excessively into the flow field near the stagnation region. The final type, a rough, angular, glaze-ice formation (fig. 2(c)), was obtained at datum air temperatures of about 300 F at moderate rates of water catch and at air temperatures down to 25 F with high rates of water catch. This glaze ice, especially near the stagnation region, formed a double-peaked mushroom shape. The growth of the ice formation was approximately normal to the airfoil surface, with the peaks jutting abruptly into the flow field and causing a flow disturbance, especially at high angles of attack. These glaze-ice formations may be associated, with combinations of flight speed, liquid-water content, and ambient-air temperature; consequently, they can occur at low altitude under conditions of low airspeed in icing clouds of high ambient-air temperature, or at high altitudes under conditions of high speed and low ambient-air temperature. In the latter case, the release of the heat of fusion and the aerodynamic heating of the airfoil surfaces combine to promote the formation of glaze ice.
A brief study of the effect of a water film at above-freezing temperatures on airfoil drag characteristics was also conducted. The water-film effect on drag at low angles of attack was negligible. At high angles of attack (8°) an increase of as much as 15 percent in the drag coefficient was obtained with a high rate of water catch. This value was, however, within the range of drag change caused by normal roughening of the airfoil surfaces by foreign particles in the tunnel air stream.
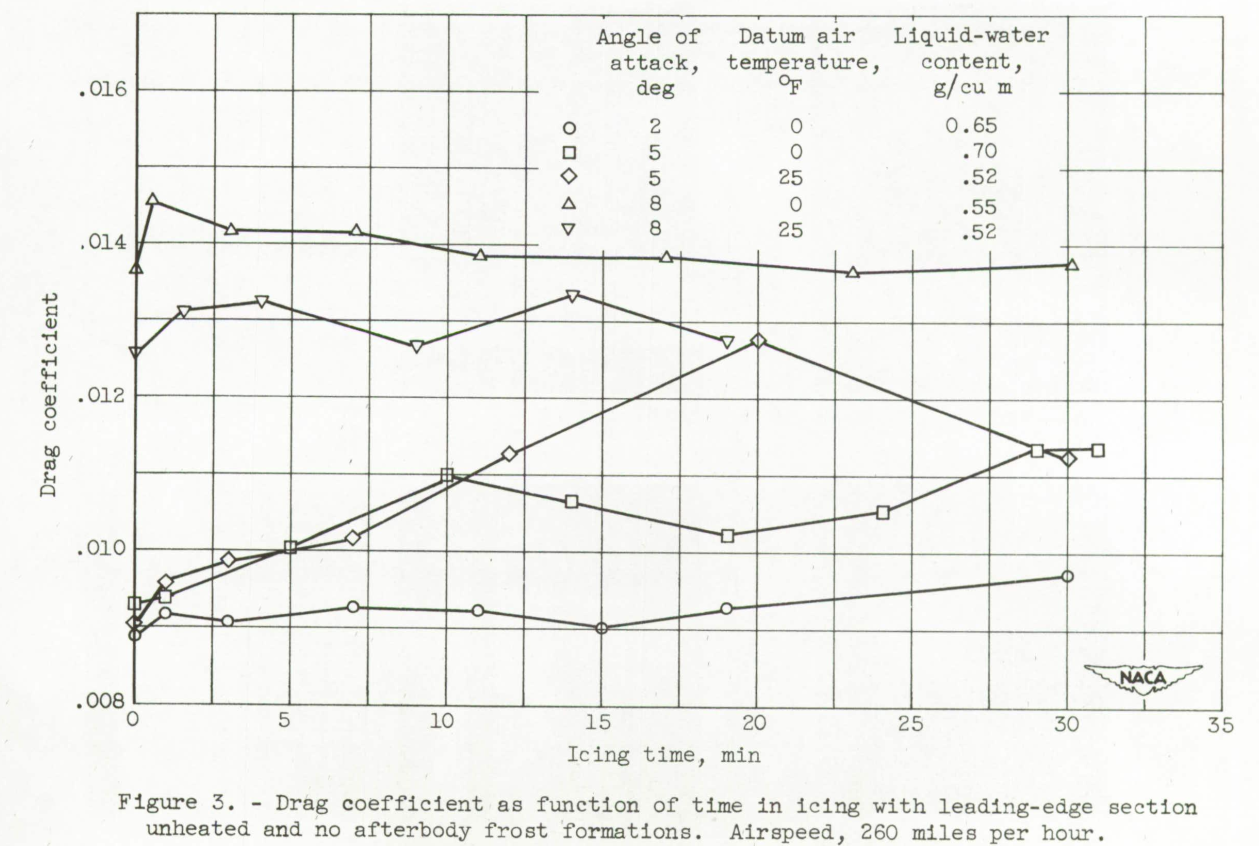
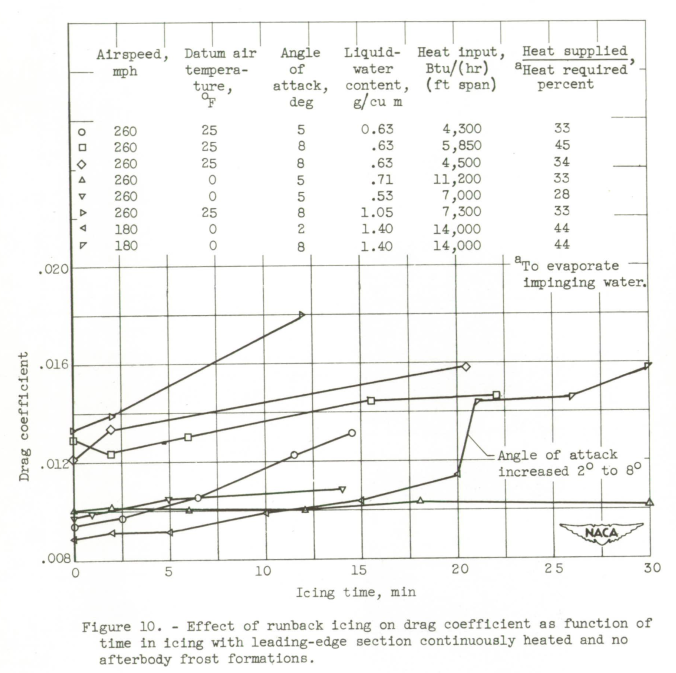
There were differing relationships for drag with time in icing. For some cases, the drag was nearly constant with time. For others, the drag changed with time in icing.
Comparable cases were run for runback ice with leading edge heating selected to not evaporate all the impinging water:
Comparisons with NACA-TR-446
Below, "ref. 4" is NACA-TR-446 2.
Correlation of Drag Caused by Icing with Drag Caused by Protuberances
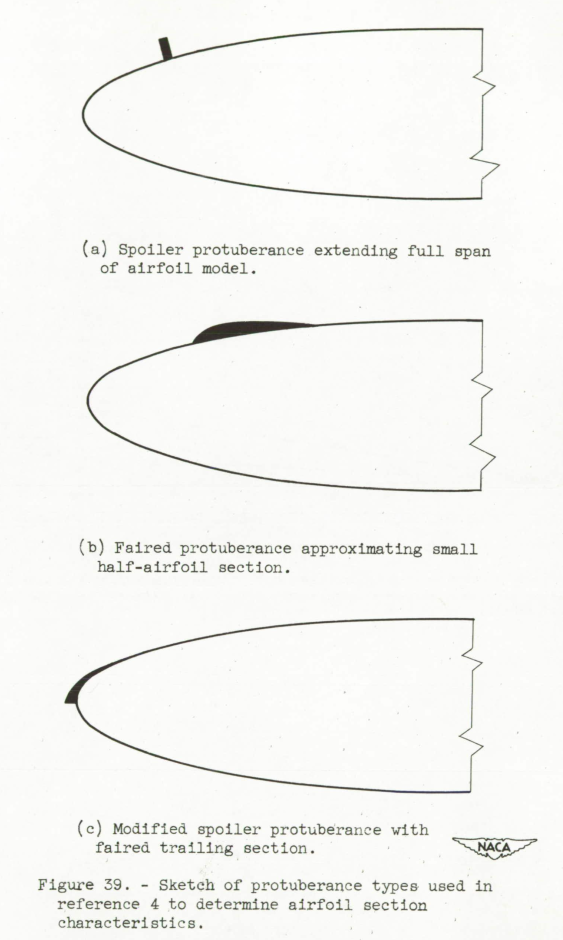
The data presented herein are necessarily limited to specific operating and icing conditions; consequently, it is highly desirable to be able to extend the drag data associated with ice formations by comparative means. Reexamination of the aerodynamic effects of protuberances (fig. 39) at various positions on an airfoil (ref. 4) together with the effects of ice formations presented herein indicates that a large part of the data in reference 4 is directly applicable for estimating the effect of ice formations on airfoil characteristics. From reference 4 it is apparent that protuberances near the stagnation region for low angles of attack do not greatly change the airfoil characteristics. A protuberance such as a mushroom-type ice formation (fig. 2(c)) is, of course, an exception. Reference 4 indicates that protuberances on the lower surface generally do not seriously affect the airfoil drag unless the protuberance is very large, as is also shown in the icing drag studies. Although the airfoil drag is affected in varying degrees by protuberances on the upper surface for all angles of attack, the most serious effects are obtained when the protuberances are near the leading edge, as was demonstrated by the serious drag increases caused by the leading-edge ice formations during the heat-off period of a cyclic de-icing system under conditions of high rates of water catch and high datum air temperature (figs. 21 to 24). The mushroom-type leading-edge ice formation and runback icing that forms in spanwise ridges can be represented by the spoiler protuberance of reference 4 (fig. 39(a)). A smoother, sheet-type runback ice formation can be represented by the faired protuberance (fig. 39(b)) used in reference 4. Such a faired protuberance generally does. not affect the drag of an airfoil seriously except if located near the stagnation region on the upper surface of the airfoil. A protuberance located at a specific point on the lower surface will generally have a smaller percentage effect on drag as the angle of attack is increased.
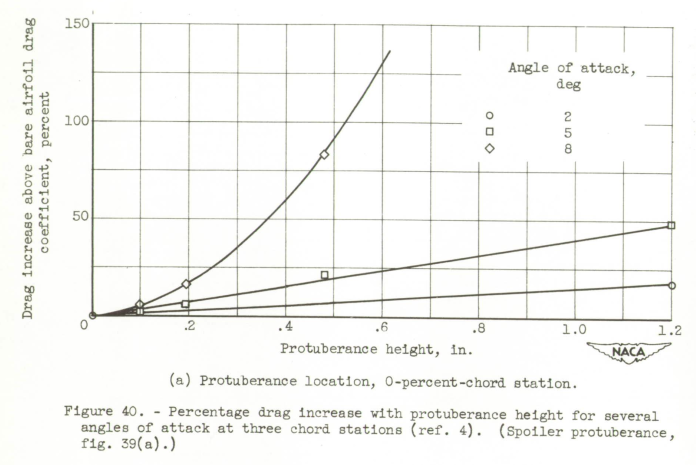
The data in reference 4 are directly applicable only to an NACA 0012 airfoil section and should not be applied to airfoils of thickness ratios greatly different from 12 percent. Because, however, the present airfoil model is of 12-percent thickness, the magnitude and trend of the aerodynamic changes caused by the protuberances of reference 4 are believed to be generally similar to those expected for an NACA 651-212 airfoil section. On the basis of this assumption, some of the data presented in reference 4 are replotted in figure 40 in terms of the percentage of drag increase as a function of protuberance height for the subject airfoil for three chord stations and three angles of attack. in addition to these data, limited data on a faired protuberance of 0.5-inch thickness (fig. 39(b)) indicate that a small increase of 0.0005 to 0.001 (6 to 10 percent of bare airfoil drag coefficient) may occur in the drag coefficient over the range of chord stations and angles of attack shown in figure 40. At the stagnation region, data for a spoiler protuberance faired on the downstream side (fig. 39(c)) indicated marked drag reduction as compared with an unfaired protuberance.
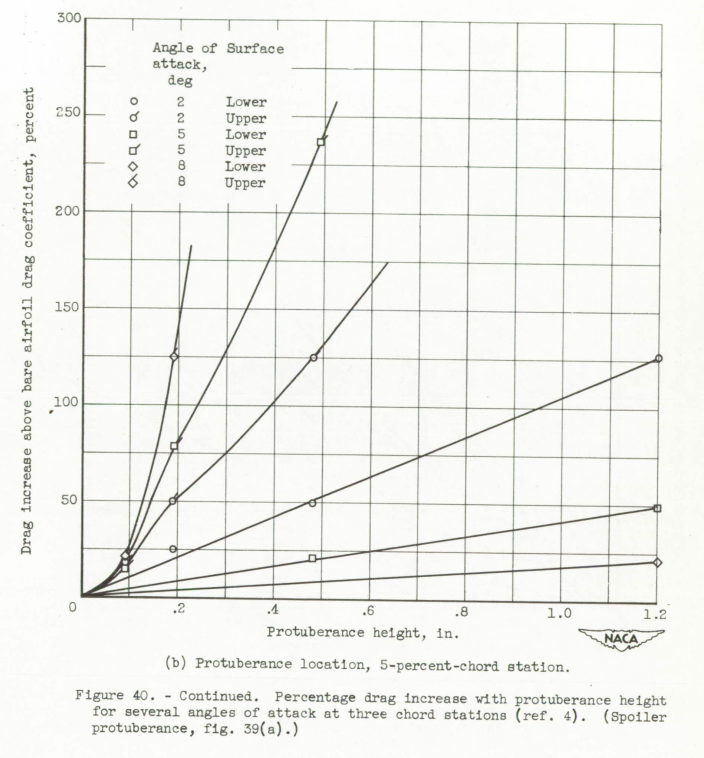
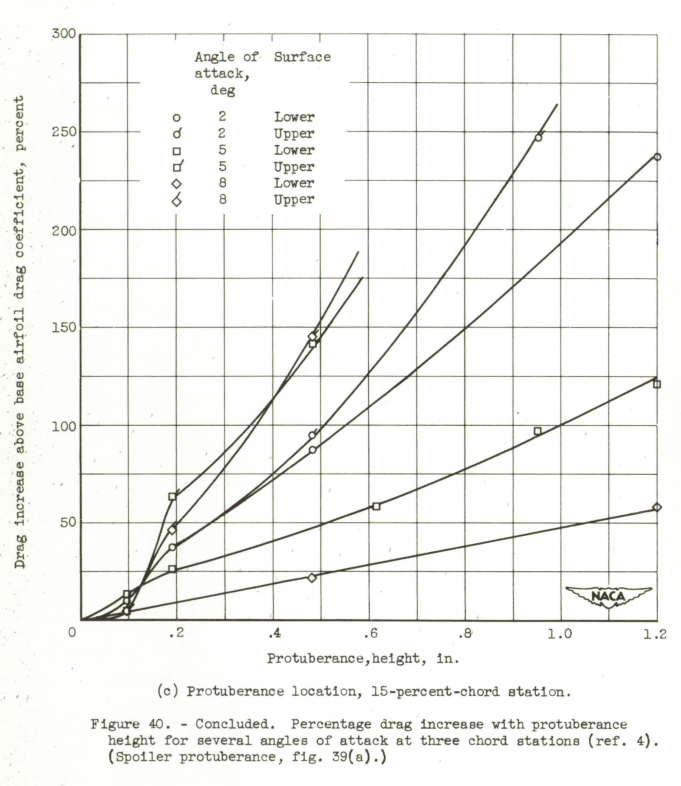
By discriminating use of the data of figure 40, reference 4, and the preceding discussion, the drag-coefficient change caused by ice formations can be estimated. However, the data presented herein and in reference 4 are limited in scope and all ice formations cannot be represented adequately by the simple protuberances investigated, especially those ice formations near the leading edge. In these cases only rough estimates of the effect of such ice formations can be made.
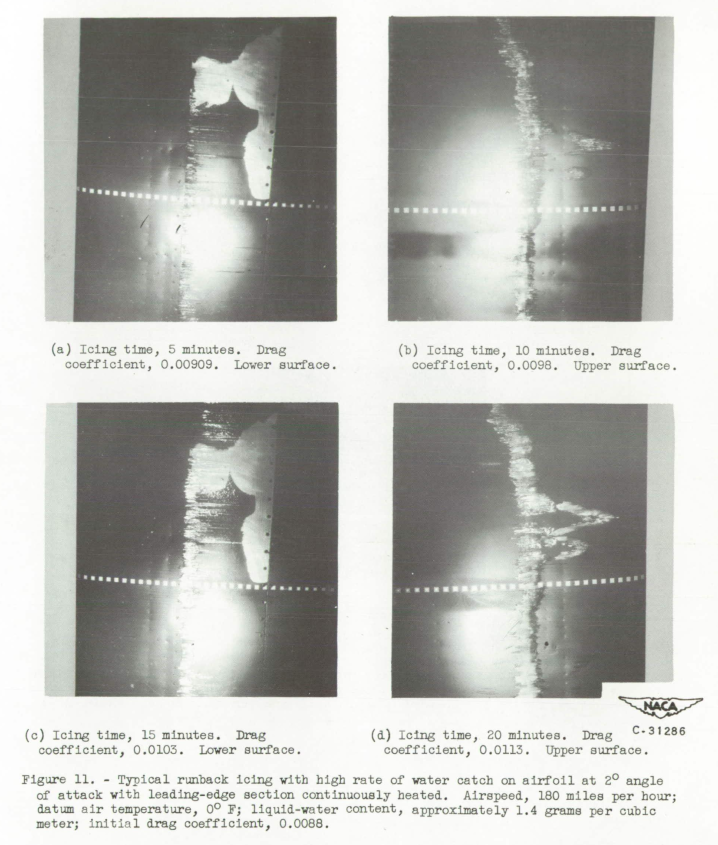
For the runback ice formations shown in figures 11(c) and (a) near the 12-percent-chord station, the height of the ice formations on both the surfaces after 20 minutes of icing is estimated at between 1/8 and 3/16 inch. According to figure 40(c), this protuberance height should result in a drag increase of about 28 percent for each formation, or a total of 56 percent. On the upper surface, however, the ice formation is more nearly represented by a faired protuberance for which the drag increase amounts to about 6 percent (ref. 4). The total estimated drag increase would therefore be approximately 34 percent. The measured increase In drag for the ice formations in figure 11 was approximately 29 percent, which agrees satisfactorily with the estimated value.
In figures 21(c) and (e) the predominant ice formations are located at the leading edge of the upper surface and at about 13 percent of chord on the lower surface. Although there is an ice formation near 3 percent of chord on the lower surface, the effect of such a protuberance is overshadowed by the greater formation at 13 percent of chord. An estimate of the leading-edge ice from figures 21(c) and(e) indicates a thickness of about 1/2 inch, with the average thickness on the lower surface at 13 percent of chord about the same. By use of figures 40(a) and (c), the estimated drag-coefficient increase is about 101 percent compared with a measured increase in drag of 96 percent. For figure 21(d) much of the ice has been removed after the heating period, and. the average ice thickness near the center span of the airfoil at 13 percent of chord is about 1/4 inch. Only thin faired runback streaks were evident on the upper surface, with a maximum thickness of about 0.1 inch which, according to reference 4 and substantiated by the drag measurements reported herein, can be neglected for drag evaluations. The total drag increase for this runback icing is estimated from figure 40(c) to be 46 percent compared with the measured increase in drag of 37 percent.
The foregoing examples were selected to illustrate the degree to which the effect of ice formations on airfoil drag characteristics can be estimated. No such close agreement between estimated and measured increases in drag coefficient can be made for the dangerous ice formations occurring between 1 and 5 percent of chord on the airfoil upper surface without additional data similar to those presented in reference 4. The estimated drag values will usually tend to be high, because the ice formations are generally more faired and discontinuous than the protuberances used in reference 4.
The Reynold number was not discussed. For the 8-foot chord airfoil in NACA-TN-2962, the Reynolds number at the 260 mph airspeed used for many of the cases was about 1.9e7. For NACA-TR-446, the chord Reynolds number was 3.1e6. There is presumably a Reynolds number effect.
The comparison above uses percent drag change between clean and iced airfoil. This avoids (but may not really solve) the problem noted in the review of NACA-WR-L-292 of a clean airfoil Cl or Cd value offset. As airfoil sections were different in the two publications, there is presumably an offset of the clean airfoil values.
Interpretation of results
Significance of Results
In the interpretation of the significance of the data presented in the preceding sections, consideration must be taken of the probability, frequency, and duration of encountering icing conditions that would cause serious increases in drag and losses in lift during flight. For example, the data for a condition of high rate of water catch and high datum air temperature indicate large drag increases at high angles of attack; however, such an attitude is generally of short duration for the aircraft and occurs primarily during the initial take-off or the final let-down stages. On the other hand, a condition of high rate of water catch and high datum air temperature at a low angle of attack. may occur relatively frequently for jet-powered fighter or bomber aircraft; consequently, this icing and operating condition may be of much greater interest with respect to drag changes and aircraft performance.
With the possibility of frost formations on airfoil afterbodies in flight assumed negligible, it would appear that low rates of water catch generally obtained by a combination of small droplets, average liquid-water content, low subsonic airspeeds, and large airfoil chords and thicknesses do not seriously affect the airfoil drag characteristics. For these same conditions of low water catch, cyclic de-icing of the leading-edge section does not improve the drag characteristics of the airfoil, principally because the airfoil drag is not seriously affected by the primary leading-edge ice formations (fig. 15). The formation of runback ice aft of the heated areas, caused by either a cyclic de-icing system or a continuously heated system which does not evaporate all the impinging water, therefore constitutes the major means of incurring a drag penalty. These drag penalties are, however, of small magnitude over the normal range of icing conditions generally encountered by jet aircraft in flight, and the loss in lift associated with these drag penalties is negligible (refs. 4 and 5). It appears, therefore, that for large airfoil chords and for thicknesses of the same magnitude as the airfoil studied, no icing protection is required for a condition of low rate of water catch and streamlined ice formation.
It should be noted that these comments apply specifically to the 12-percent-thick airfoil section investigated. Use of smaller chord or thinner airfoils will result in higher and more rapid drag-coefficient increases and possibly a more serious deterioration in lift for comparable ice formations. The initial drag coefficient of the bare airfoil was in the range generally associated with standard roughness, for which some surface waviness, dustiness, and protective coating may be present. It is believed that if a completely clean and aerodynamically smooth airfoil were exposed to icing conditions, the drag coefficient would quickly rise, especially in the low-drag range, by as much as 100 percent to approach the initial drag coefficients reported herein for the bare airfoil. Thereafter ice formations of the streamlined type would contribute no appreciable drag increase.
A mushroom-type glaze-ice formation resulting from icing encounters with combinations of high liquid-water content, large droplet size, high airspeed, and high datum air temperatures will cause large and rapid increases in drag for which most aircraft may require protection. From the data presented in figures 20 and 25 it is apparent that an airfoil equipped with a cyclic de-icing system is most susceptible to drag penalties at high angles of attack and during approach operation. It is therefore essential that high angles of attack be avoided if a heavy deposit of mushroom-type glaze ice has been incurred on the leading edge. Proper operation of the aircraft, by shedding of heavy leading-edge ice formations before assuming an approach attitude, should minimize the danger of stalling the airfoil.
Runback ice formations on the lower surface increase the drag some-what but do not appear to affect seriously the airfoil aerodynamic characteristics. If the upper surface of an airfoil is subject to little or no runback icing and the lower surface is permitted to accumulate runback icing, a substantial reduction in heating requirements over those calculated in reference 1 can be achieved. Thus, the use of a continuous heating system might be extended to protect high-altitude, high-speed, turbojet-powered aircraft without the large performance penalties indicated in reference 1 for a system designed to evaporate all the impinging water.
For certain types of aircraft that need only penetrate a stratus cloud layer immediately after take-off and are capable of rapid descent through such a cloud layer, the magnitude of the ice formation accumulated during the flight through the layer may not seriously affect the aircraft performance. Upon ascent, the ice formations may decrease by sublimation at high altitude and high speed at rates up to 1 inch of thickness per hour. Should the expected accumulation of ice formations on an airfoil during descent prove incompatible with the aircraft performance specifications, an icing-protection system may be included that. is designed to operate only for low-speed let-down conditions. Such an icing-protection system could operate either cyclically or continuously with a relatively low heating requirement.
The icing of an aircraft in flying through a cumulus cloud at high altitude should not prove excessively detrimental to aircraft performance, because the aircraft will in all probability be at a low angle of attack, a flight condition not conducive to large changes in airfoil performance characteristics.
Although the possibility exists of forming frost on aircraft surfaces during flight, the probability of such an occurrence appears to be quite remote. Frost formations during ground operation, however, are quite common in cold climates and, with respect to the drag losses associated with such formations on airfoil surfaces, merit attention. The use of a conventional thermal icing-protection system to remove frost from the leading-edge region of an airfoil will not provide sufficient protection to ensure a safe take-off. It is, therefore, necessary in all-weather operation to provide additional protection from frost for the aircraft while on the ground, such as sheltering the wings and empennage surfaces with heated covers, tents, or hangars.
Conclusions
SUMMARY OF RESULTS
The results of an investigation of the effects of ice and frost formations on the drag of an NACA 651-212 airfoil section may be summarized as follows:
1. At high angles of attack (8°), a prohibitive increase in drag coefficient of approximately 70 percent was obtained within 2 minutes when ice formed on the upper surface near the leading edge of the airfoil under conditions of heavy glaze icing (high rate of water catch and high datum air temperatures).
2. Relatively small formations of glaze icing (low rates of water catch and high datum air temperature) increased the drag coefficient of the airfoil over the range of conditions studied by less than 27 percent following a 30-minute icing period, except for simulated landing approaches. Rime-ice formations associated with lower air temperatures did not increase the airfoil drag coefficient appreciably above the initial (standard roughness) level, even with high rates of water catch.
3. A glaze-ice formation on the leading-edge section for a simulated approach condition, during which the airfoil attitude is increased from 2° to 8° angle of attack, caused a severe increase in drag coefficient of over 285 percent over the bare airfoil drag at 8° angle of attack and was accompanied by a shift in the position of the momentum wake that indicated incipient stalling of the airfoil.
4. Runback icing on the lower surface obtained with the use of a continuous heating system that does not evaporate all the impinging water caused moderate drag increases only when a spanwise ridge of ice was formed aft of the heatable area.
5. Removal of the primary ice formations by cyclic de-icing caused the drag to return almost to the bare airfoil drag coefficient, except for the drag caused by runback ice formations. In general, runback icing with a cyclic de-icing system increased the drag less than did runback icing incurred in similar conditions with a continuous heating system that only evaporated approximately 28 to 44 percent of the impinging water.
6. Frost formations on the airfoil surfaces caused a large and rapid increase in the drag coefficient and at high angles of attack (8°) were accompanied by incipient stalling of the airfoil.
Citations
NACA-TN-2962 cites 7 publications:
- Gelder, Thomas F., Lewis, James P., and Koutz, Stanley L.: Icing Protection for a Turbojet Transport Airplane: Heating Requirements, Methods of Protection, and Performance Penalties. NACA-TN-2866, 1953. ntrs.nasa.gov
- Lewis, James P., and Bowden, Dean T.: Preliminary Investigation of Cyclic De-Icing of an Airfoil Using an External Electric Heater. NACA-RM-E51J30, 1952. ntrs.nasa.gov
- Gray, Vernon H., Bowden, Dean T., and von Glahn, Uwe H.: Preliminary Results of Cyclical De-icing of a Gas-Heated Airfoil. NACA-RM-E51J29, 1952. ntrs.nasa.gov
- Jacobs, Eastman N.: Airfoil Section Characteristics as Affected by Protuberances. NACA-TR-446, 1932 ntrs.nasa.gov.
- Gulick, Beverly G.: Effects of a Simulated Ice Formation on the Aerodynamic Characteristics of an Airfoil. NACA-WR-L-292, May 1938. ntrs.nasa.gov
- Perkins, Porter J., McCullough, Stuart, and Lewis, Ralph D.: A Simplified Instrument for Recording and Indicating Frequency and Intensity of Icing Conditions Encountered in Flight. NACA-RM-E51E16, 1951. ntrs.nasa.gov
- Gray, Vernon H., and Bowden, Dean T.: Comparison of Several Methods of Cyclic De-Icing of a Gas-Heated Airfoil. NACA-RM-E53C27, 1953. ntrs.nasa.gov
NACA-TN-2962 is cited 8 times in the NACA Icing Publications Database3
- Gray, Vernon H., and Bowden, Dean T.: Comparison of Several Methods of Cyclic De-Icing of a Gas-Heated Airfoil. NACA-RM-E53C27, 1953. ntrs.nasa.gov
- von Glahn, Uwe H., and Gray, Vernon H.: Effect of Ice Formations on Section Drag of Swept NACA 63A-009 Airfoil with Partial-Span Leading-Edge Slat for Various Modes of Thermal Ice Protection. NACA-RM-E53J30, 1954. ntrs.nasa.gov
- Bowden, Dean T.: Investigation of Porous Gas-Heated Leading-Edge Section for Icing Protection of a Delta Wing. NACA-RM-E54I03, 1955. ntrs.nasa.gov
- Bowden, Dean T.: Effect of Pneumatic De-Icers and Ice Formations on Aerodynamic Characteristics of an Airfoil. NACA-TN-3564, 1956. ntrs.nasa.gov
- Gray, Vernon H., and von Glahn, Uwe H.: Heat Requirements for Ice Protection of a Cyclically Gas-Heated, 36 Swept Airfoil with Partial-Span Leading-Edge Slat. NACA-RM-E56B23, 1956. ntrs.nasa.gov
- Gray, Vernon H., and von Glahn, Uwe H.: Aerodynamic Effects Caused by Icing of an Unswept NACA 65A004 Airfoil. NACA-TN-4155, 1958. ntrs.nasa.gov
- Gray, Vernon H.: Correlations Among Ice Measurements, Impingement Rates, Icing Conditions and Drag Coefficients for an Unswept NACA 65A004 Airfoil. NACA-TN-4151, 1958. ntrs.nasa.gov
- Gray, Vernon H.: Prediction of Aerodynamic Penalties Caused by Ice Formations on Various Airfoils. NASA-TM-D-2166, 1964. archive.org
An online search 4 found 48 citations of NACA-TN-2962.
Notes
-
Gray, Vernon H., and von Glahn, Uwe H.: Effect of Ice and Frost Formations on Drag of NACA 651-212 Airfoil for Various Modes of Thermal Ice Protection. NACA-TN-2962, 1953. ntrs.nasa.gov ↩
-
Jacobs, Eastman N.: Airfoil Section Characteristics as Affected by Protuberances. NACA-TR-446, 1932 ntrs.nasa.gov. ↩