"In view of the number and complexity of the possible sources of error, it is not possible at this time to make a reliable estimate of the total accuracy" 3
Summary
Calculations are made to assess the probability of encountering certain icing conditions.
Introduction
In Porter Perkins Ice Shapes and Ice Protection, references NASA TM 83564 1 and NASA TM 86906 2, the probability of encountering certain icing conditions was assessed, using methods from NACA-TN-2738 3. Here, we will attempt to reproduce those calculations.
Discussion
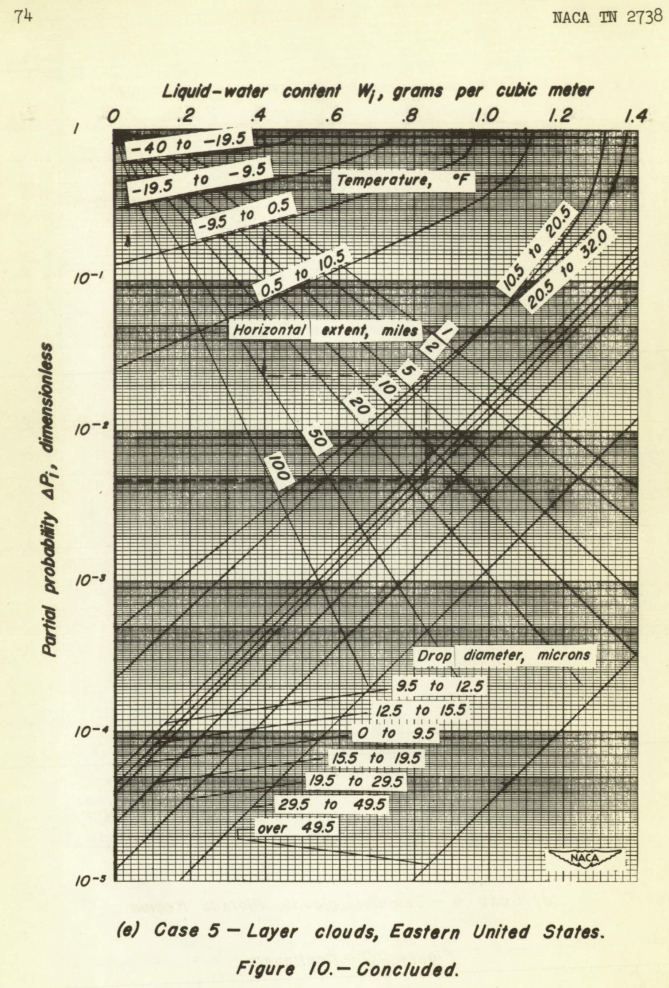
In NACA-TN-2738, data were divided by geographical region.
The NASA Technical Memos did not state where the natural icing test flights were. However, as three of the authors were based out of the NASA Lewis Research Center, Cleveland, Ohio, I will assume that the flights operated out of there and were in the Eastern United States region.
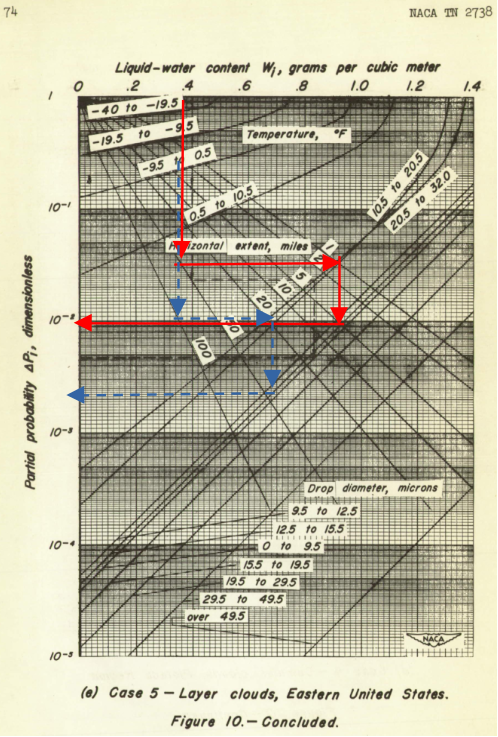
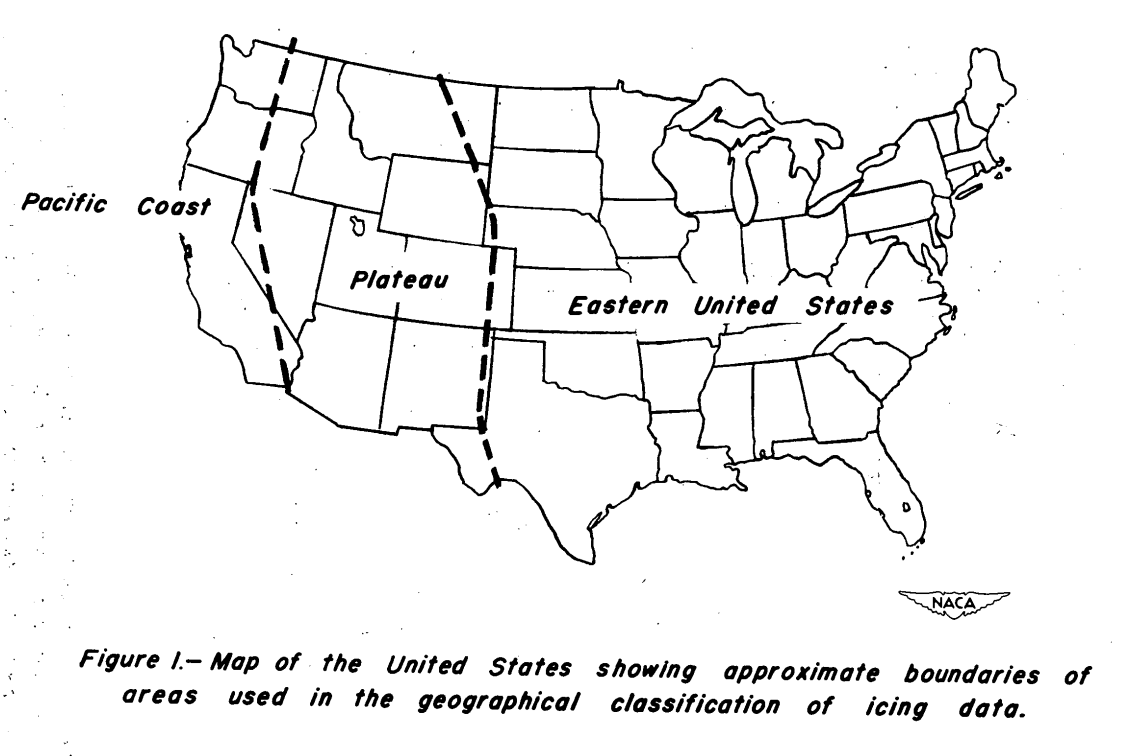
So, the appropriate chart to use is Figure 10(e):
NACA-TN-2738 explains:
Probability of encountering icing conditions which exceed certain specified values.
If, for a particular element of a thermal system and a chosen value of horizontal cloud extent, combination values of liquid-water content, drop diameter, and temperature are specified which the element can just tolerate, the values would define a surface in T'-D-W space. Such a surface can be viewed as representing the locus of liquid-water-content values to which the element is critical over specified ranges of temperatures and drop diameters. Individual values on such a surface would be obtained through knowledge of the area, rate, and distribution of water-drop impingement for the particular element.As is evident from figure 10, seven intervals of drop diameter and six intervals of temperature were used in the construction of the charts.
Thus, the probability of being in any one of the 42 bins (7 drop size bins x 6 temperature bins) at a given temperature and distance in icing can be assessed.
NASA TM 83564 1 briefly describes using the probability calculations for the icing flight test data:
Frequency of Occurrence.- An approach to categorizing the severity of an icing encounter is to relate that encounter to the frequency of its occurrence. All the pertinent icing encounter parameters that determine intensity (LWC, extent of icing, droplet size distribution,median volume diameter,and air temperature) should be treated in combination in assessing the probability of exceeding the intensity of a specific condition. Lewis and Bergrun [NACA-TN-2738] analyzed statistically all the available data obtained in icing flights up to that time (1952) and presented these data in probability charts. In one approach, plots are provided to determine the probability of equaling or exceeding any specified value of LWC under the condition that the value is associated simultaneously with values of temperature and drop diameter lying within specified intervals. The plots are based on preselected values of horizontal extent. Thus, all the icing encounter parameters associated with intensity are considered.
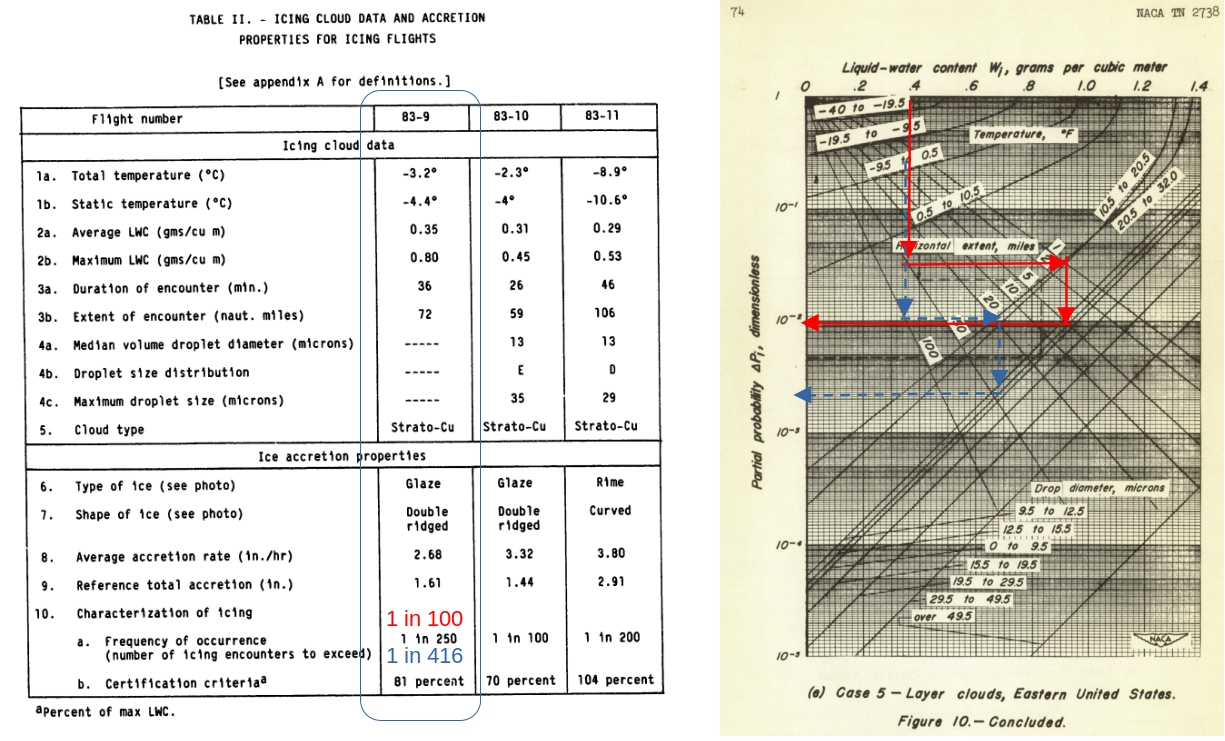
These probability plots were used to associate the severity of the icing conditions reported herein with the previously determined statistics. For each icing flight the measured value of average LWC occurring simultaneously with the other measured icing parameters are used with the plots to determine what the chances are in that normal flight operations of equaling or exceeding specific LWC value. For example, the LWC measured in flight 83-9 (0.35 gms/m^3) would be equaled or exceeded in only 1 out of 250 icing encounters when formed in combination with the other measured icing parameters (see table II). This low probability stems primarily from the unusual duration of the icing produced by the procedure of holding within the icing cloud.
Extract of Table II from NASA TM 83564 1:
| Flight: | 83-9 | 83-10 | 83-11 |
|---|---|---|---|
| Extent of encounter (nmi) | 72 | 59 | 106 |
| Static air temperature (C) | -4.4 | -4 | -10.6 |
| Average LWC (g/m^3) | 0.35 | 0.45 | 0.53 |
| Median volume drop diameter (micrometer) | --- | 13 | 13 |
| Type of ice | Glaze | Glaze | Rime |
| Shape of ice | Double ridged |
Double ridged |
Curved |
| Average accretion rate (in/hr) | 2.68 | 3.32 | 3.8 |
| Reference total accretion (inch) | 1.61 | 1.44 | 2.91 |
| (a) Frequency of occurrence (number of icing encounters to equal or exceed) |
1 in 250 | 1 in 100 | 1 in 200 |
| (b) Certification criteria (percentage of max LWC) | 81 % | 70 % | 104 % |
| Frequency as probability (F = 1 / P) (NASA TM calculation) | 0.0040 | 0.01 | 0.005 |
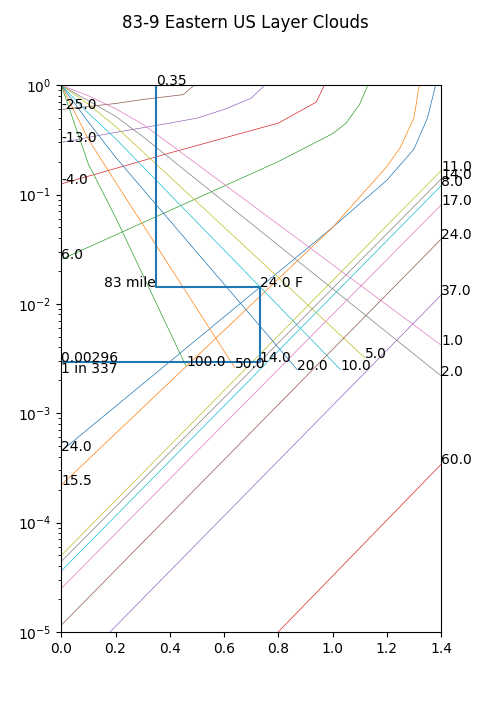
For flight 83-9, the distance is 72 nmi, or 83 statute miles (the units used on NACA-TN-2738). The closest temperature bin is 20.5 to 32 F, nominally labeled 24 F. A drop size was not given in table II, and a value is required for the calculation, so it is assumed to be the same as the other two flights, 13 micrometer. The closest drop size bin is 12.5 to 15.5 micrometer, nominally labeled 14 micrometer.
The procedure defined in NACA-TN-2738 is to start at the top of the chart at the LWC value, descend to the distance line, go across to the temperature bin line, go down to the drop size bin line, and then across to the probability value. A challenge is that there is not a distance line at 83 miles. In the figure below values are assessed for the bounding 50 and 100 mile lines. The values found bound the reported value.
I think this illustrates the challenges in getting a precise value from method. The author (presumably Porter Perkins) appropriately reported values to at most 2 digits precision (and may have used "one and a half" digits, rounding to the nearest 50).
A digitized version of the chart was also used for calculations herein. Distance was interpolated here (logarithmic interpolation). It gives a precise, although perhaps not more accurate, result. The imprecision of reading the values accurately off of the chart for coding are hard to estimate. The 1 in 337 result only approximates the reported value.
Marginal surface calculations
A marginal surface probability calculation can also be made, summing up the probabilities from each of the 42 temperature-drop size bins. NACA-TN-2738 Table VI is an example. The NASA Technical Memos did not make this calculation. Here, the marginal surface has the same LWC value in each bin, and a format similar to Table VI is used. The calculation is reported to 5 digits, so some bins have a probability of zero.
Eastern Region US
For Distance = 82.8 miles
Median temperature, F 24.0          15.5          6.0           -4.0          -13.0         -25.0
Temperature interval  32.0 to 20.5  20.5 to 10.5  10.5 to 0.5   0.5 to -9.5   -9.5 to -19.5 -19.5 to -40
MED  Interval         Wi   deltaPi  Wi   deltaPi  Wi   deltaPi  Wi   deltaPi  Wi   deltaPi  Wi   deltaPi
  8     0 to  9.5     0.35 0.00279  0.35 0.00337  0.35 0.00001  0.35 0.00000  0.35 0.00000  0.35 0.00000
 11   9.5 to 12.5     0.35 0.00385  0.35 0.00466  0.35 0.00002  0.35 0.00000  0.35 0.00000  0.35 0.00000
 14  12.5 to 15.5     0.35 0.00330  0.35 0.00398  0.35 0.00001  0.35 0.00000  0.35 0.00000  0.35 0.00000
 17  15.5 to 19.5     0.35 0.00189  0.35 0.00229  0.35 0.00001  0.35 0.00000  0.35 0.00000  0.35 0.00000
 24  19.5 to 29.5     0.35 0.00090  0.35 0.00109  0.35 0.00000  0.35 0.00000  0.35 0.00000  0.35 0.00000
 37  29.5 to 49.5     0.35 0.00028  0.35 0.00033  0.35 0.00000  0.35 0.00000  0.35 0.00000  0.35 0.00000
 60  49.5 to  inf     0.35 0.00001  0.35 0.00001  0.35 0.00000  0.35 0.00000  0.35 0.00000  0.35 0.00000
        Totals        ---  0.01301  ---  0.01573  ---  0.00006  ---  0.00000  ---  0.00000  ---  0.00000
Sum totals: 0.02880
Weighted average of three regions
NACA-TN-2738 also describes:
The three regions (fig. 1) have area ratios of about 1/8, 2/8, and 5/8 for the Pacific coast, plateau, and eastern regions, respectively; and these area ratios were used to weight the values of liquid-water content from the equiprobability charts so that the resulting average values would be on a comparable basis with the values expressed In NACA TN 1855.
However, this was apparent not used for the NASA analysis, as results calculated using the weighted regions average agreed less well with the published values than when using the eastern region only.
Three region weighted average
For Distance = 82.8 miles
Median temperature, F 24.0          15.5          6.0           -4.0          -13.0         -25.0
Temperature interval  32.0 to 20.5  20.5 to 10.5  10.5 to 0.5   0.5 to -9.5   -9.5 to -19.5 -19.5 to -40
MED  Interval         Wi   deltaPi  Wi   deltaPi  Wi   deltaPi  Wi   deltaPi  Wi   deltaPi  Wi   deltaPi
  8     0 to  9.5     0.35 0.00228  0.35 0.00249  0.35 0.00008  0.35 0.00000  0.35 0.00000  0.35 0.00000
 11   9.5 to 12.5     0.35 0.00295  0.35 0.00328  0.35 0.00008  0.35 0.00000  0.35 0.00000  0.35 0.00000
 14  12.5 to 15.5     0.35 0.00249  0.35 0.00277  0.35 0.00006  0.35 0.00000  0.35 0.00000  0.35 0.00000
 17  15.5 to 19.5     0.35 0.00164  0.35 0.00171  0.35 0.00006  0.35 0.00000  0.35 0.00000  0.35 0.00000
 24  19.5 to 29.5     0.35 0.00102  0.35 0.00094  0.35 0.00005  0.35 0.00000  0.35 0.00000  0.35 0.00000
 37  29.5 to 49.5     0.35 0.00035  0.35 0.00031  0.35 0.00002  0.35 0.00000  0.35 0.00000  0.35 0.00000
 60  49.5 to  inf     0.35 0.00003  0.35 0.00001  0.35 0.00000  0.35 0.00000  0.35 0.00000  0.35 0.00000
        Totals        ---  0.01076  ---  0.01152  ---  0.00034  ---  0.00000  ---  0.00000  ---  0.00000
Sum totals: 0.02262
Conclusions
To recap the comparisons:
NASA TM 83564 1:
| Flight: | 83-9 | 83-10 | 83-11 |
|---|---|---|---|
| Extent of encounter (nmi) | 72 | 59 | 106 |
| Static air temperature (C) | -4.4 | -4 | -10.6 |
| Average LWC (g/m^3) | 0.35 | 0.45 | 0.53 |
| Median volume drop diameter (micrometer) | --- | 13 | 13 |
| Type of ice | Glaze | Glaze | Rime |
| Shape of ice | Double ridged |
Double ridged |
Curved |
| Average accretion rate (in/hr) | 2.68 | 3.32 | 3.8 |
| Reference total accretion (inch) | 1.61 | 1.44 | 2.91 |
| (a) Frequency of occurrence (number of icing encounters to equal or exceed) |
1 in 250 | 1 in 100 | 1 in 200 |
| (b) Certification criteria (percentage of max LWC) | 81 % | 70 % | 104 % |
| Frequency as probability (NASA TM calculation) | 0.0040 | 0.01 | 0.005 |
| Frequency as probability (calculated herein) | 0.0030 | 0.0075 | 0.0047 |
NASA TM 86906 2:
| Flight: | 84-19 | 84-27 | 84-34 |
|---|---|---|---|
| Extent of encounter (nmi) | 110 | 57 | 50 |
| Static air temperature (C) | -6.8 | -5.2 | -6.5 |
| Average LWC (g/m^3) | 0.30 | 0.34 | 0.58 |
| Median volume drop diameter (micrometer) | 11 | 15 | 10 |
| Type of ice | Mix | Glaze | Mix |
| Average accretion rate (in/hr) | 2.9 | 3.4 | 5.8 |
| Reference total accretion (inch) | 2.4 | 1.4 | 2.1 |
| (a) Frequency of occurrence (number of icing encounters to equal or exceed) |
1 in 450 | 1 in 150 | 1 in 900 |
| (b) Certification criteria (percentage of max LWC) | 88 % | 79 % | 104 % |
| Frequency as probability (NASA TM calculation) | 0.0022 | 0.0067 | 0.0011 |
| Frequency as probability (calculated herein) | 0.0039 | 0.0055 | 0.0008 |
The terse description of the analysis in the NASA Technical Memos required some assumptions to implement the calculations.
Given the numerous opportunities for differences with reading manually or digitizing the complex figures in NACA-TN-2738, the reproducibility of prior results is limited.
Related
This is part of the Porter Perkins review series.
The NASA Memos were reviewed in broader detail.
NACA-TN-2738 was previously reviewed.
Notes
-
Ranaudo, R. ,J.; Mikkelsen, K. L.; McKnight, R. C. and Perkins, P. J. Jr., "Performance Degradation of a Typical Twin Engine Commuter Type Aircraft in Measured Natural Icing Conditions," NASA TM 83564 and AIAA-84-0179, 1984. ntrs.nasa.gov ↩↩↩↩
-
Mikkelsen, K. L., McKnight, R. C., Ranaudo, R. J. and Perkins, P. J. Jr., "Icing Flight Research: Aerodynamic Effects of Ice and Ice Shape Documentation with Stereo Photography," NASA TM 86906 or AIAA-85-0468, 1985. ntrs.nasa.gov ↩↩
-
Lewis, William, and Bergrun, Norman R.: A Probability Analysis of the Meteorological Factors Conducive to Aircraft Icing in the United States. NACA-TN-2738, 1952. ntrs.nasa.gov ↩↩