"published aerodynamic data for performance penalties in icing conditions are not readily applicable to a very thin airfoil"
NACA-TN-4151, "Correlations Among Ice Measurements, Impingement Rates, Icing Conditions and Drag Coefficients for an Unswept NACA 65A004 Airfoil"
and
NACA-TN-4155, "Aerodynamic Effects Caused by Icing of an Unswept NACA 65A004 Airfoil"
These two publications reference each other, and so are reviewed together.
Summary
Correlations are develop between ice shapes, aerodynamic performance, and icing conditions.
Key Points
- More than 60 ice shapes were measured in an icing wind tunnel for a thin airfoil section.
- Correlations were developed between ice shapes, aerodynamic performance, and icing conditions.
Abstract
NACA-TN-4155:
The effects of ice formations on the section lift, drag, and pitching-moment coefficients of an unswept NACA 65A004 airfoil section of 6-foot chord were studied. The magnitude of the aerodynamic penalties was primarily a function of the shape and size of the ice formation near the leading edge of the airfoil. The exact size and shape of the ice formations were determined photographically and found to be complex functions of the operating and icing conditions.
In general, icing of the airfoil at angles of attack less than 40 caused large increases in section drag coefficients (as much as 350 percent in 8 minutes of heavy glaze icing), reductions in section lift coefficients (up to 13 percent), and changes in the pitching-moment coefficient from diving toward climbing moments.
At angles of attack greater than 40 the aerodynamic characteristics depended mainly on the ice type. The section drag coefficients generally were reduced by the addition of rime ice (by as much as 45 percent in 8 minutes of icing). In glaze icing, however, the drag increased at these angles of attack. The section lift coefficients were variably affected by rime-ice formations; however, in glaze icing, lift increases at high angles of attack amounted to as much as 9 percent for an icing time of 8 minutes. Pitching-moment-coefficient changes in icing conditions were somewhat erratic and depended on the icing condition.
Rotation of the iced airfoil to angles of attack other than that at which icing occurred caused sufficiently large changes in the pitching-moment coefficient that, in flight, rapid corrections in trim might be required in order to avoid a hazardous situation.
NACA-TN-4151:
An empirical relation has been obtained by which the change in drag coefficient caused by ice formations on an unswept NACA 65AO04 airfoil section can be determined from the following icing and operating conditions: icing time, airspeed, air total temperature, liquid-water content, cloud droplet impingement efficiencies, airfoil chord length, and angles of attack. The correlation was obtained by use of measured ice heights and ice angles. These measurements were obtained from a variety of ice formations, which were carefully photographed, cross-sectioned, and weighed. Ice weights increased at a constant rate with icing time in a rime icing condition and at progressively increasing rates in glaze icing conditions. Initial rates of ice collection agreed reasonably well with values predicted from droplet impingement data. Experimental droplet impingement rates obtained on this airfoil section agreed with previous theoretical calculations for angles of attack of 40 or less. Disagreement at higher angles of attack was attributed to flow separation from the upper surface of the experimental airfoil model.
Discussion
These two publications have an author in common, were published the same month, and reference each other, and so are reviewed together. NACA-TN-4155 may be thought of as the lab report documenting the icing wind tunnel test results, and NACA-TN-4151 as an analysis report of the test results to develop correlations.
These are relatively long (46 and 48 pages), so highly condensed summaries will follow. Readers are encouraged the read the full papers, available at NACA-TN-4151 and NACA-TN-4155.
NACA-TN-4155
Published aerodynamic data are useful for estimating the performance penalties in icing conditions for large transport and bomber aircraft, but are not readily applicable to high-speed high-altitude interceptor aircraft because such aircraft generally utilize a very thin airfoil (thickness ratio of the order of 4 percent). These interceptor aircraft cruise at altitudes at which little, if any, icing occurs. The icing, problem of these aircraft is confined primarily to climb and descent, which are generally of short duration because of the high rates of climb and descent. The aircraft may occasionally be required to loiter during letdown at altitudes where icing can occur; however, because the over-all icing hazard is much reduced for these aircraft compared to conventional transport aircraft, the elimination of airframe icing protection equip- ment appears attractive. It is therefore necessary to determine the aerodynamic penalties caused by icing of thin airfoil sections in order to assess the need for icing protection equipment on lifting and control surfaces of high-speed interceptor aircraft.
In order to provide such data for use in interceptor-aircraft mission analyses, studies were made in the NACA Lewis icing tunnel of the aerodynamic penalties associated with icing of an unswept NACA 65A004 airfoil section of 6-foot chord. These studies included the effect of icing on the airfoil-section lift, drag, and pitching-moment coefficients. In addition, photographs of the cross sections of the ice formations causing the changes in the aerodynamic characteristics of the airfoil were obtained.
APPARATUS
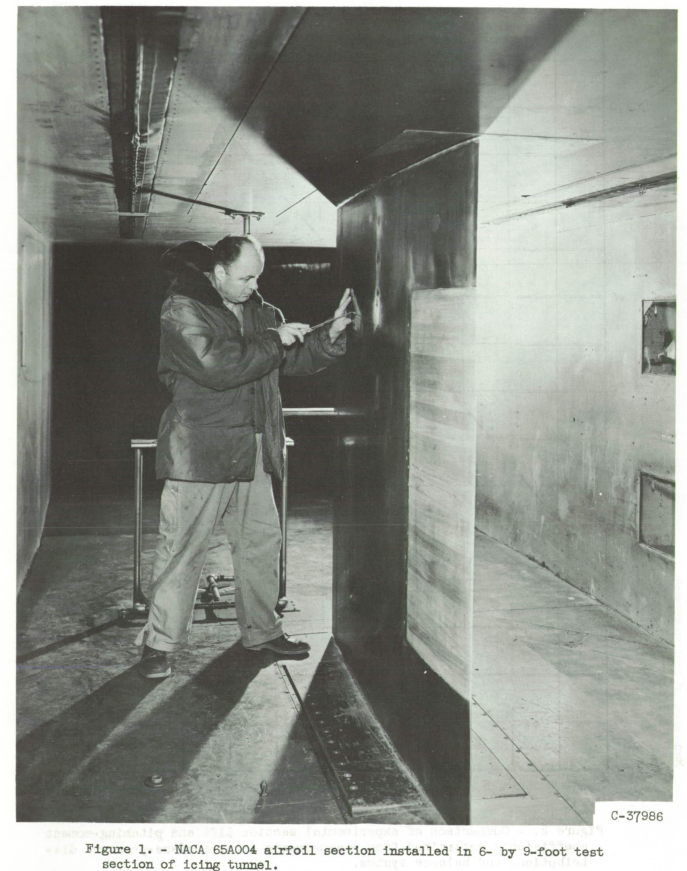
The model consisted of an NACA 65A004 airfoil section of 6-foot chord. (Coordinates for this section are given in ref. 4). The model was mounted vertically to span the 6-foot height of the Lewis icing tunnel (fig. 1). The airfoil was equipped with a 42-inch-span removable leading-edge section that provided for installation of a variety of icing protection systems. For this study, however, the removable section was constructed of wood and covered with a sheet of 0.010-inch-thick neoprene to prevent abrasion of the surface. The leading-edge section extended to 27 percent of the chord. The remainder of the airfoil section was constructed of stainless steel and was internally steam heated to prevent the accumulation of frost due to tunnel-air supersaturation and turbulence.
All initial values of section lift, drag, and pitching-moment coefficients for the clean airfoil are corrected for tunne1-wall interference effects by use of equations given in reference 10. In general, compared with the measured values for the clean airfoil, the corrected lift was approximately 16 percent less, the corrected drag about 8 percent less, the corrected pitching moment up to 18 percent more negative at high angles of attack, and the corrected angle of attack a maximum of about. 12 percent greater.
Analysis of the effect of tunnel-wall interference on changes in the airfoil aerodynamic characteristics caused by ice formations showed negligible corrections. To obtain absolute values of the respective coefficients for the iced airfoil, the corrected initial coefficients are added to the uncorrected changes in coefficients caused by icing.
Except as noted, the data shown are in terms of changes in the aerodynamic characteristics of the airfoil with duration in icing. In the calculations of all aerodynamic coefficients the increase in planform area caused by the ice formations (less than 3 percent) was neglected.Ice-Formation Characteristics
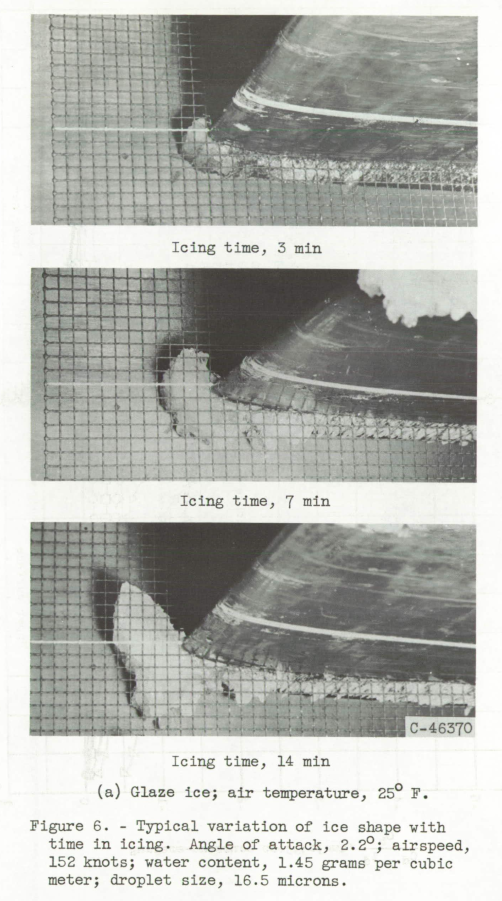
Typical photographs of ice formations observed on the leading-edge region of the airfoil are shown in figures 6 to 8. These ice formations fit into the general categories of glaze, intermediate, and rime ice. The glaze-ice formations (fig. 6(a)) are characterized by bluff nearly transparent ice caps that protrude from the surface normal to the local airstream.Variation of Aerodynamic Characteristics with Icing Time, Ice Shape, and Angle of Attack
The changes in section lift, drag, and pitching-moment coefficients with icing time obtained in this study are shown in figures 9 and 10 for various constant angles of attack. Also shown in these figures are cross sections of the ice deposits on the leading-edge region of the airfoil. These sketches were traced from photographs of the ice taken at the end of the runs (similar to those shown in figs. 6 to 8) and depict the ice shapes for only about the forward 7 percent of the airfoil.
(There are numerous photos of the ice shapes and effects cases, here is only a sample.)
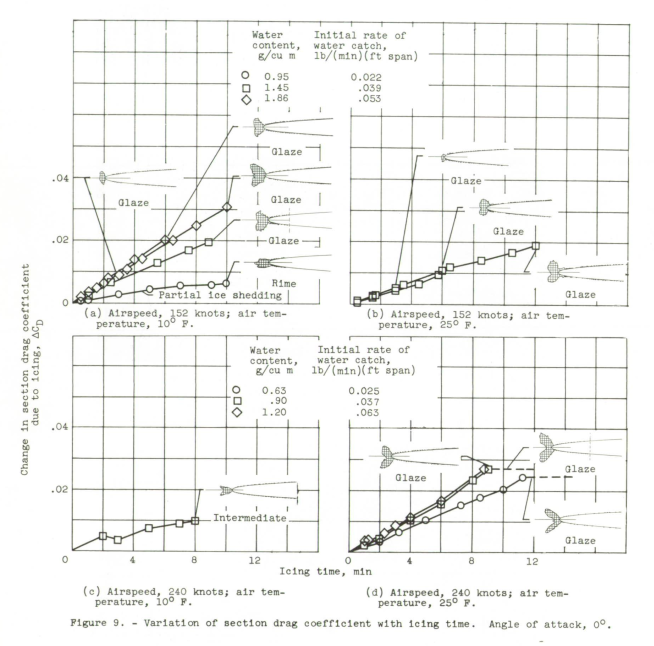
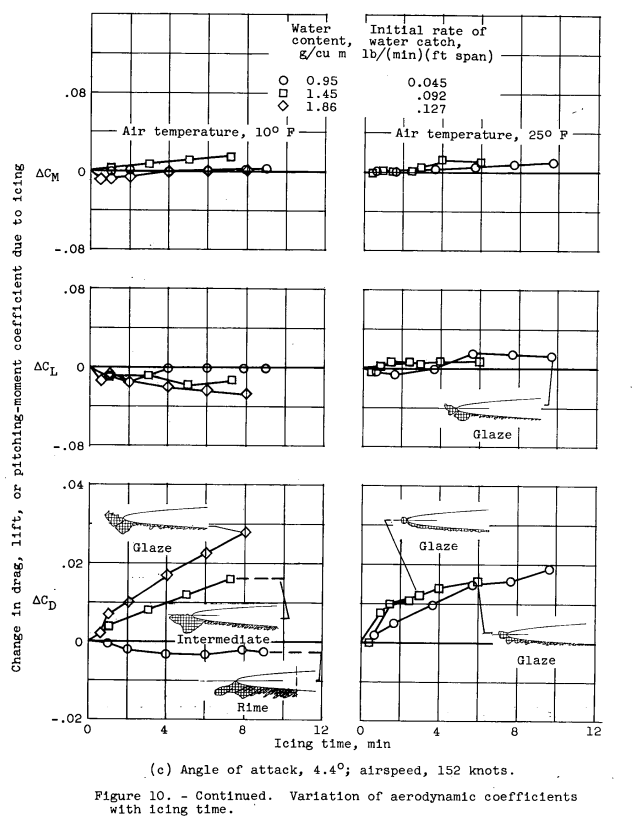
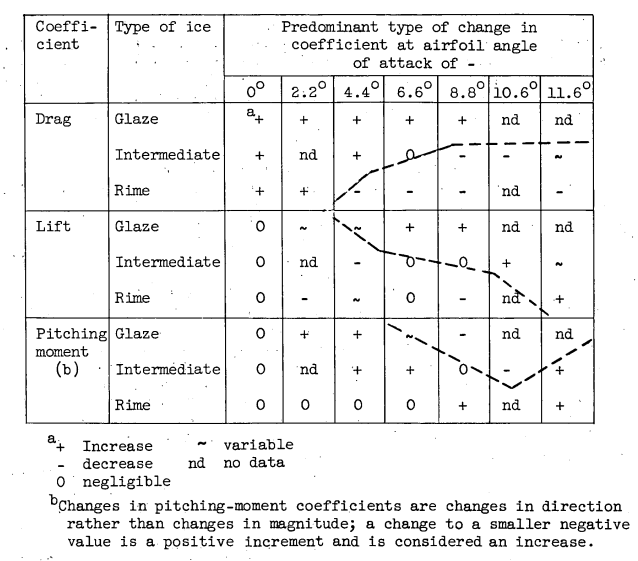
In general, analysis of the aerodynamic data and the ice-formation photographs showed that, in icing conditions, changes in the aerodynamic characteristics of the airfoil were related to the size and shape of the ice formations. The ice size and the resulting changes in aerodynamic coefficients generally increased progressively with increasing icing time. With ice classified as glaze, rime, or intermediate, the general trends in the aerodynamic changes due to ice shown in figures 9 and 10 can be summarized as follows:
NACA-TN-4151
Very briefly, the ice shapes from NACA-TN-4155 were measured and tabulated in Table II, which is too extensive to reproduce here. Correlations were then developed.
#Different coordinates from NACA-TR-446
The coordinate system of NACA-TR-446 3, x/chord and h/chord, were apparently considered.
The ice deposits in the present study are represented by two dimensions, h and θ, as shown in figure 7. Dimension h is the height of the edge of the ice first reached in going from the upper to the lower surface. The angle θ is measured between this ice edge and the extended chord line. The angle is positive if above the chord line and negative if the ice edge falls below the extended chord line. These measurements are given in table II for most of the icing runs.
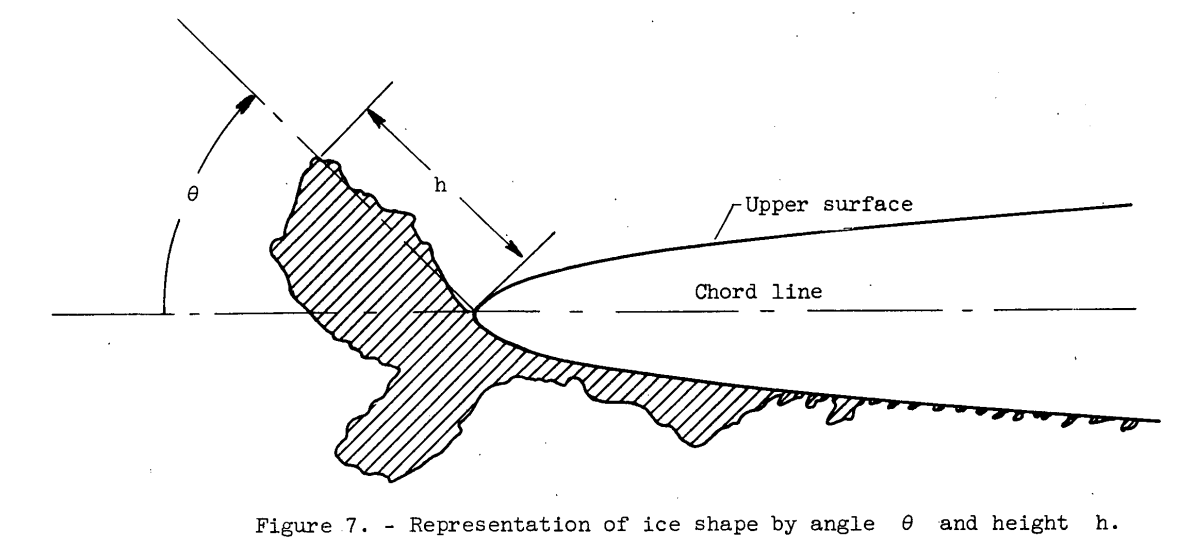
Representation of ice formations by these two dimensions only ignores the part of the ice toward and on the lower surface of the airfoil. Generally, protuberances on this region contribute very little drag to the airfoil, except near zero angle of attack. In contrast, flow spoilers near the leading edge and toward the upper surface cause large drag increases; this surfacewise variation in effect of spoilers is illustrated in reference 11 and is directly related to the local-velocity distribution over the airfoil. On the present 65A004 airfoil section the ice formations on the upper surface extended only a very short distance from the zero-chord point, as indicated in table II. Consequently, for this airfoil section, little variation in chordwise location of the significant ice deposit occurred, and chordwise measurements of ice deposits were abandoned in favor of the ice angle θ. This angle, in conjunction with h, thus determines the critical feature of an ice deposit with respect to aerodynamic drag; also, θ provides a scale of measurement of the type of ice (from rime to glaze).
Correlations
Correlation Between Ice Shape and Icing Conditions
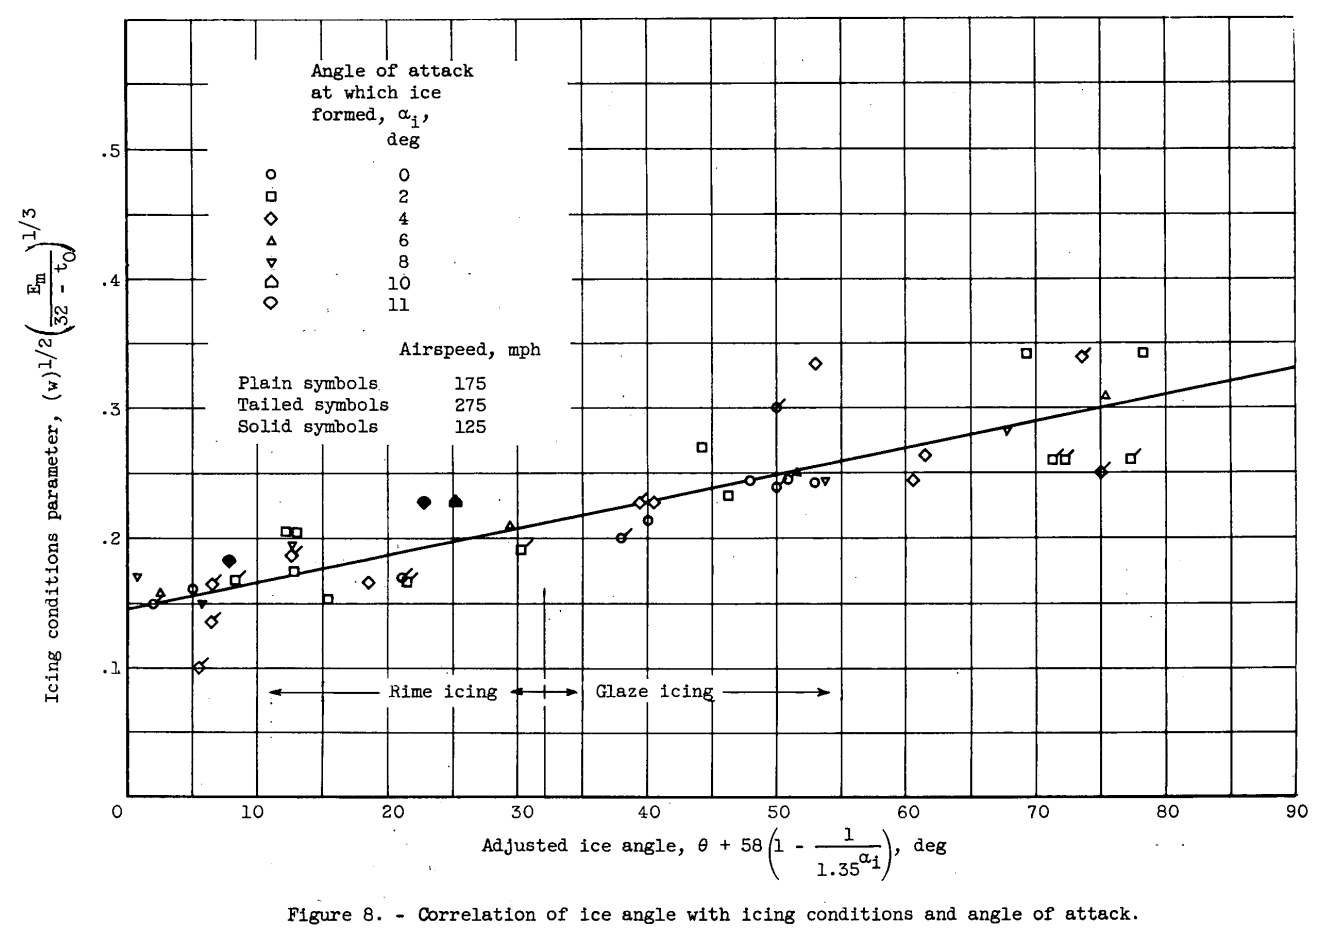
Ice angle. - In the data of table II, the ice angle θ increases with increasing impingement rates and air temperatures and decreasing angles of-attack. An empirical relation between these variables is shown in figure 8 for the present airfoil data. The ice angle θ in the abscissa of figure 8 is modified by the addition of the expression 58(1 - 1/1.35^αi) to account for the variation of 0 with the angle of attack αi. The abscissa is thus a measurement of the type of ice formation, with a value of 32 approximately dividing the observed rime ice from the glaze ice. The ordinate of figure 8 is the expression w^0.5*(Em/(32-t_o)^(1/3) . Although considerable scatter of data points exists, the exponents and coefficients were each adjusted until an equal scattering of data about an average straight line was obtained. For the present data, air velocity had a negligible effect on 0, and the best correlation was obtained with the velocity term absent. As mentioned previously, the tunnel-cloud droplet size varied according to the liquid-water content and velocity, and thus the effect on ice angle of the droplet size as an independent variable was not obtainable. However, the Em factor in the ordinate is sensitive to changes in drop size, and the present conclusion is in substantial agreement with unpublished NACA flight data obtained for various ice formations on a 1/2-inch-diameter cylinder. The expression resulting from the plot in figure 8 is as follows:
θ = 483 w^0.5 (Em/(32-t_o)^(1/3) - 72 - 58 (1 - 1/1.35^αi), deg   (1)

where
w is liquid water content, g/m^3
Em is total droplet impingement efficiency
t_o is free-stream total temperature, F
αi is angle of attack during icing, degree
Thus, equation (1) relates the ice angle θ to the icing and operating conditions that are generally known or calculable in a flight performance study.
Ice height. - In a manner similar to that for the angle θ, the ice height h was correlated with the various icing conditions, as shown in figure 9. The relations shown in this figure yield the following expression
h = 4.35X10⁻⁴ τ V_o (w β_m)*0.5 (32-t_o)^0.3   (2)

where
τ is time in icing, minute
V_o is airspeed, mph
β_m is maximum local droplet efficiency
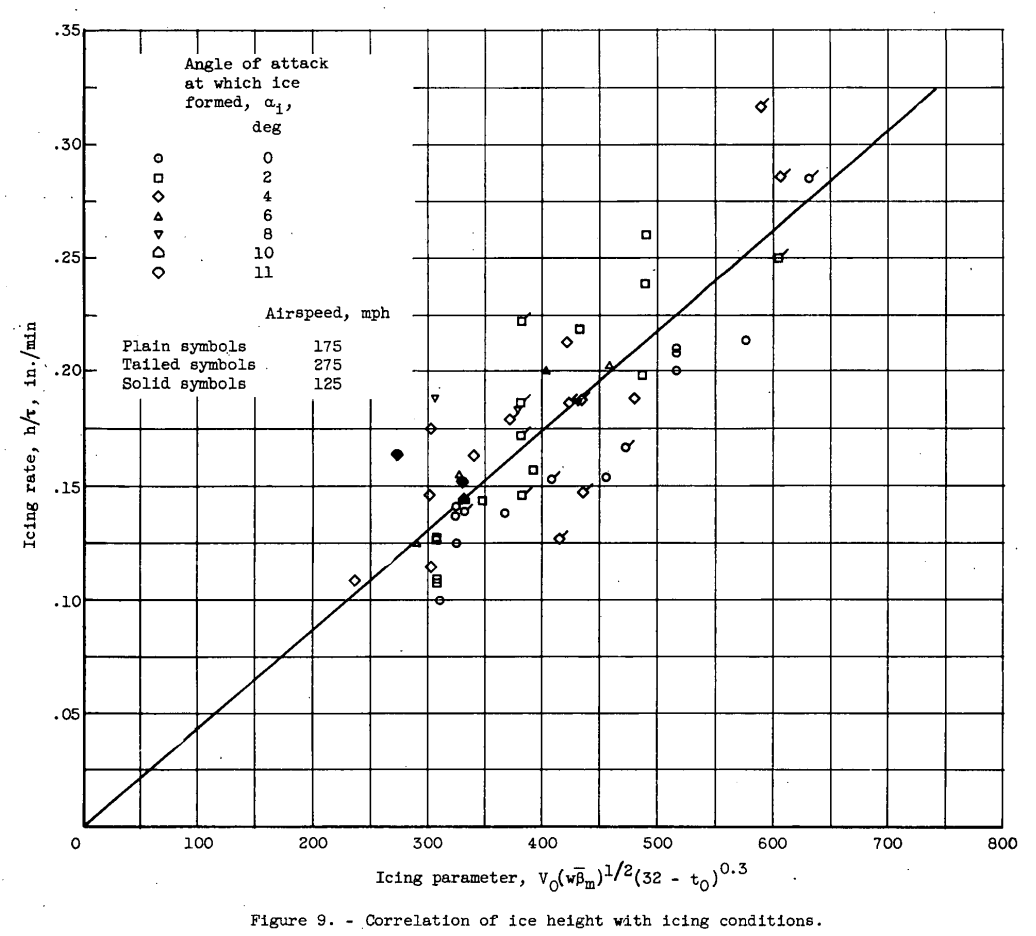
In equation (2) h varies approximately linearly with icing time and velocity. figure 6 shows that the ice weight increased linearly with time for rime icing conditions but exceeded a linear relation for glaze icing conditions. These peculiarities may be explained by the geometry of the ice shape. Whereas rime icing deposits tend to grow directly into the airstream and thus form rectangular cross sections, glaze icing deposits grow both forward and laterally, and resemble triangular (or trapezoidal) cross sections with the base growing away from the airfoil. Thus, the area of a rectangle (analogous to weight of rime ice) increases linearly with its length (dimension h), while the area of a triangle (weight of glaze ice) increases faster than its height, by virtue of the increasing base. Therefore, the observed linear variation of ice height with time (fig. 9) is not inconsistent with the trends of ice weight against time (fig. 6).
The present measurements of airfoil ice formations were all obtained on the 6-foot-chord airfoil, and consequently body size (or chord) was not varied. However, the ice height correlation of eqiation (2) agrees remarkably well with unpublished measurements obtained on the following bodies: 0.8-inch-chord streamlined strut, 0.5-inch-diameter cylinder, and 0.1-inch-diameter cylinder. As noted in the preceding section, the ice-angle correlation also agreed with limited data obtained on a 1/2- inch-diameter cylinder. These unpublished data substantiate the correlations given for ice height and angle, which should be valid over a considerable range of body size and shape.
Correlation Between Ice Shape and Drag-Coefficient Changes
Changes in airfoil drag coefficients due to protuberances are shown in reference 10 to vary linearly with protuberance height-to-chord ratio in most cases. As discussed previously, and in references 9 and 11, changes in airfoil drag coefficients due to ice formations are also expected to vary almost linearly with some ratio of ice thickness to chord (herein h/c). Consequently, a linear relation was assumed for simplicity, and the change in drag coefficient due to ice (ΔCD) was divided by the height-to-chord ratio h/c to remove the ice thickness variation from the drag change and permit a study of the other variables. In figure 10 the term ΔCD/100h is plotted against the angle 0 for the airfoil data in table II. The ordinate is the change in drag coefficient caused by the various ice formations corrected to a common height equal to 1 percent of chord. These drag-coefficient changes are shown for each angle of attack investigated.
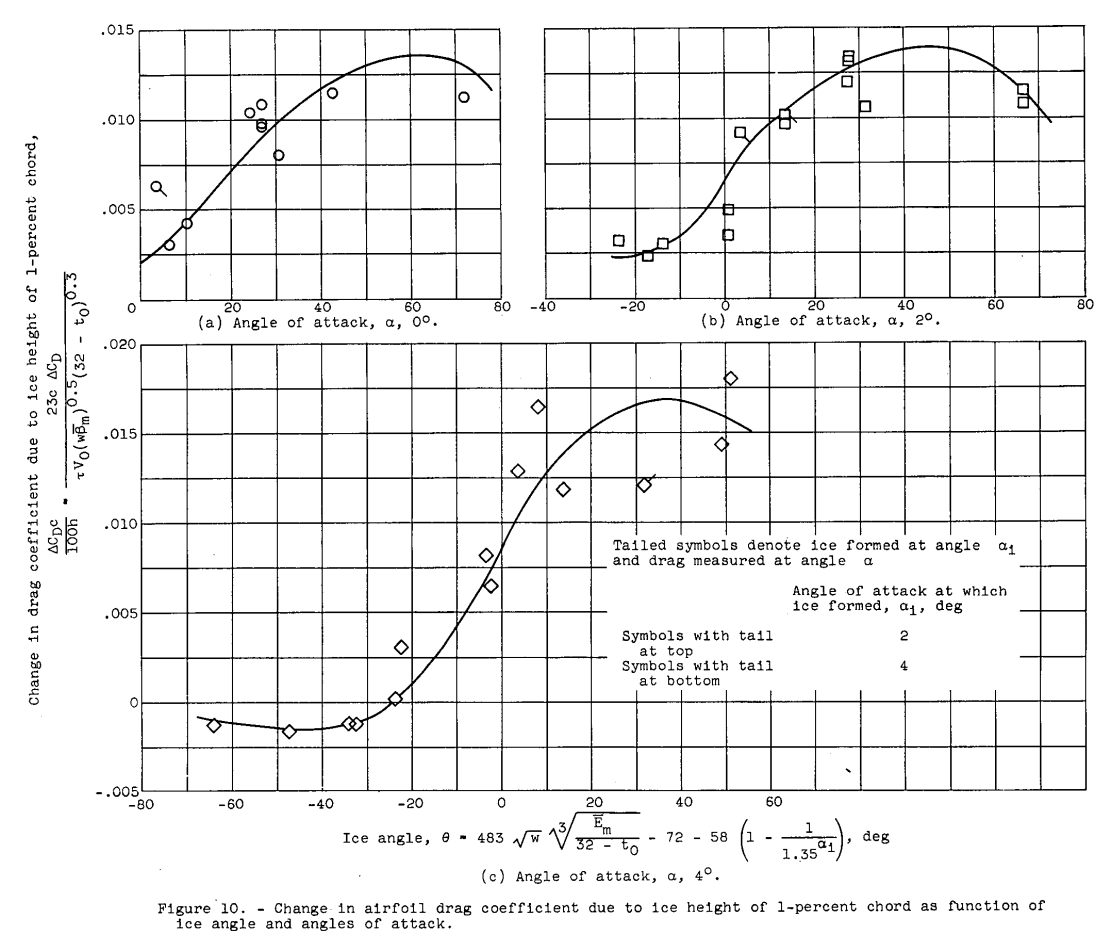
Data scatter in figure 10 is again considerable, but mean curves for each angle-of-attack condition are readily discernible. The trends with respect to 0 and a are very pronounced. As discussed in refer- ence 2, the airfoil drag coefficient is considerably reduced by the addition of ice at the higher angles of attack and negative angles of 0. For figure 10, the relations given in equations (1) and (2) were utilized to determine U and h, respectively. Thus, as shown by the scale legends, the terms U and h, which generally are unknown, are eliminated and CD may be determined from known icing and operating conditions.
Final Correlation Between Drag-Coefficient Changes and Icing Conditions
By use of figure 10 the changes in airfoil-section drag coefficients due to ice formations may be determined from the icing and operating conditions. These relations are shown for each of several angles of attack. To obtain a complete relation, it is necessary to determine an equation to account for the effects of angle of attack in figure 10. A trigonometric equation form was selected to fit the curves in figure 10 for two reasons. First, the data fitted into curves suggestive of sine functions somewhat better than into straight lines; and second, reasoning as to the probable nature of the curves beyond the data limits indicated that each curve would probably have a maximum and a minimum value as a function of 0.
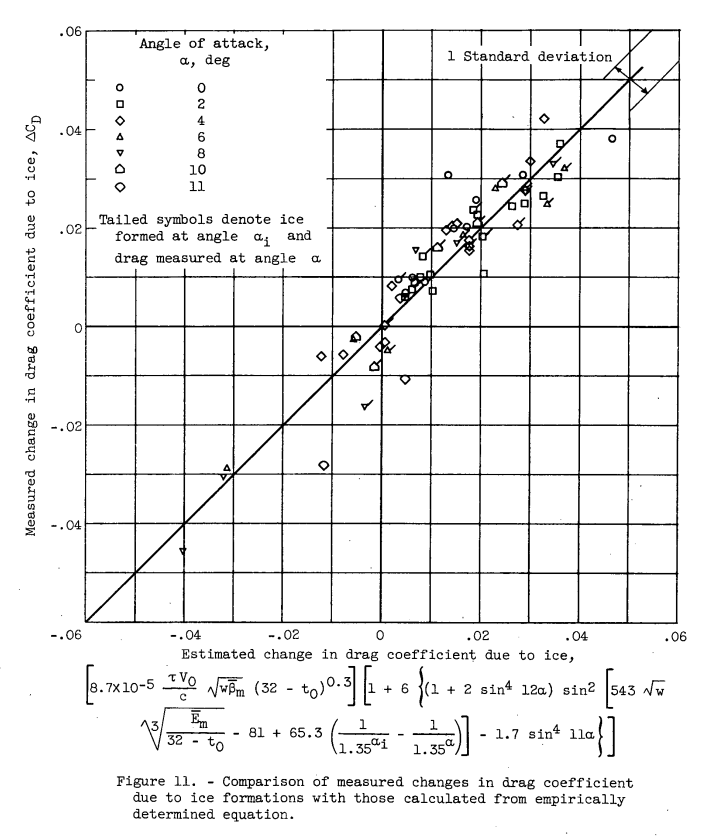
The first bracket of equation (3) accounts for the height-to-chord ratio of the ice that acts as a flow spoiler, and the second bracket accounts for the ice angle, the angle of attack, and the case wherein ice is formed at an angle of attack different from that under consideration. This latter case is accounted for by the term
65.3 (1/1.35^αi - 1/1.35^α)
which vanishes when ice is formed at the same angle of attack as that being considered (αi = α). In the sin^2 function in the second bracket of equation (3) the expression
543 w^0.5 (E_m / (32-t_o)^(1/3) - 81
is valid between the limits of 0 and 180; beyond these limits a value of zero should be used for the expression instead of a calculated number.
The measured ΔCD values from table II are plotted in figure 11 against the calculated values using equation (3). The mean value of the data points falls on the line of perfect agreement, and the standard deviation from the mean is ±0.0059, which indicates that about 68 percent of the calculated data points agree with the measured values within a ΔCD difference of 0.0059.
CONCLUDING REMARKS
It should be noted that the preceding correlation is a first-order approximation applicable to an unswept NACA 65A004 airfoil section, and extension of the variables beyond the range of.present data might give erroneous results. The present analysis shows primarily that correlations between icing conditions, icing deposits, and aerodynamic drag characteristics are possible. For a correlation of similar data for a variety of airfoils, the present equation would need additional variables to account for airfoil shape.
The present data correlation is influenced greatly by the thinness of the airfoil, the pointed leading edge, and the flow separation from the upper surface at high angles of attack. Thicker airfoils with blunt leading edges would have few or no cases of drag reductions with ice, and any correlation among ice shape, angle of attack, and change in drag would probably be more orderly.
The drag-coefficient changes due to ice formations are predicted by the final equation virtually without limits (e.g., with very long icing times). Realistically, however, drag increases are eventually limited by presently unknown shedding characteristics of the ice, and drag reductions are probably limited to values that yield section drag coefficients comparable to those of the lowest-drag airfoil sections known at the particular angle-of-attack condition.
This correlation concerns only the changes in section drag coefficients; changes in lift and pitching-moment coefficients were not studied; however, estimates of the lift and pitching-moment changes can be made based on the trends in the aerodynamic data of NACA TN 4155. Also, a similar analysis for lift and moment coefficient changes could probably be made from the data of TN 4155.
Several secondary factors were ignored in making the present analysis. In reducing the ice shape to two dimensions, an angle and a height, the following factors were unaccounted for: relative bluntness or sharpness of the peak of the ice formation, chordwise location of the upper-surface edge of the ice formation, and amount and location of lower-surface ice. These factors all have noticeable effects on the aerodynamic data and would undoubtedly reduce the data scatter if properly accounted for. However, this correlation should be useful in estimating the effects of icing encounters on various flight operations and missions. For these estimates, direct and internally consistent calculations can be made with the final equation derived in this report.
Conclusions
NACA-TN-4155 Conclusion:
SUMMARY OF RESULTS
A study of the effect of ice formations on the lift, drag, and pitching-moment characteristics of an unswept NACA 65A004 airfoil determined the following principal results:
1. The magnitude of the aerodynamic penalties was primarily a function of the shape and size of the ice formation near the leading edge of the airfoil. The size and shape of the ice formation in turn was a complex function of such variables as water content, droplet size, air temperature, icing time, airfoil angle of attack, and airspeed. (Empirical correlations among these variables, the ice shape, and aerodynamic drag due to ice are given in TN 4151, based on the present data.)
2. In general, icing of the airfoil at angles of attack less than 4° was detrimental to the aerodynamic characteristics. Icing caused large increases in section drag coefficient (as much as 350 percent in 8 minutes of heavy glaze icing), reductions in section lift coefficients (up to 13 percent), and changes in the pitching-moment coefficient from diving toward climbing moments.
3. At angles of attack greater than 4° the aerodynamic characteristics of the airfoil were at times either penalized or improved by ice formations on the airfoil, depending mainly on whether the ice was glaze or rime in character. In rime-icing conditions the section drag coefficient was generally reduced by icing compared to that for the clean airfoil (by as much as 45 percent in 8 minutes of icing). In glaze-icing conditions drag rises occurred at these higher angles of attack; however, the lift also increased, as much as 9 percent for an icing time of 8 minutes. Pitching-moment coefficients in icing conditions were somewhat erratic and depended on the icing condition.
4. Drag reductions due to, ice on this airfoil were possible because at times the ice formations altered the aerodynamic shape sufficiently to reduce the extent of upper-surface flow separation below the amount present in clear air (beginning at an angle of attack near 4°). Lift increases due to ice were partly attributed to reductions in extent of flow separation and partly to lift forces on the ice itself, which at times was analogous to a leading-edge flap.
NACA-TN-4151 Conclusions:
SUMMARY OF RESULTS
From an analysis of impingement, ice deposits, and aerodynamic drag for an unswept NACA 65A004 airfoil section exposed to icing conditions in the NACA Lewis icing tunnel, the following principal results were obtained:
1. A general correlation was obtained relating the change in airfoil-section drag coefficient due to ice formations to the following icing and operating conditions: icing time, airspeed, chord length, liquid-water content, cloud droplet impingement efficiencies, air total temperature, and airfoil angles of attack.
2. It was found possible to relate changes in airfoil drag coefficients to two significant measurements of the ice formations, a height dimension and an ice angle.
3. A variety of ice formations were photographed, weighed, cross-sectioned, measured, and correlated with the icing conditions in which they were formed.
4. Ice-formation weights increased at approximately constant rates with increasing time in a rime icing condition and at progressively increasing rates in glaze icing conditions. Initial rates of ice collection agreed reasonably well with values predicted from droplet impingement data.
5. Experimental droplet impingement rates on this airfoil section agreed with previous theoretical calculations for angles of attack of 40 or less. Disagreement at higher angles of attack was attributed to flow separation from the upper surface of the experimental airfoil model.
6. An equation is derived that can be used in conjunction with TN 4155 in estimating the effects of icing encounters on flight performance for an NACA 65A004 airfoil section.
Related
We can see elements of a "freezing fraction" calculation from Messinger 4 in equations (1) and (2) from above.
θ = 483 w^0.5 (Em/(32-t_o)^(1/3) - 72 - 58 (1 - 1/1.35^αi), deg   (1)

h = 4.35X10⁻⁴ τ V_o (w β_m)*0.5 (32-t_o)^0.3   (2)
LWC (w) and a water catch efficient term (E_m or β_m) are in both, and a temperature difference.
From Messinger (equations re-arranged), we also see a water catch rate and a temperature difference:
mw = LWC * β * V_o  or mw = LWC * E_m / length * V_o

n = ((hc * (ts - ta)) + (Le * hc * 0.7 / cp * (pvs - pv) / p) + (mw * cpw * (ts - ta))
      -(hc * (r * u**2 / 2 / cp))-(mw * (u**2 / 2))) / (Lf * mw)
However, author Gray used dimensional values, not a dimensionless parameter, in his correlation.
Citations
NACA-TN-4151 cites 11 publications:
- Dickey, Thomas A.: An Analysis of the Effects of Certain Variables in Determining the Form of an Ice Accretion. AEL 1206, April 1952 (presented at Mt. Washington Spring Planning Conference, Engineering Laboratory, Naval Air Experimental Station, 29 May 1952).
- Gray, Vernon H., and von Glahn, Uwe H.: Aerodynamic Effects Caused by Icing of an Unswept NACA 65A004 Airfoil. NACA-TN-4155, 1958. ntrs.nasa.gov
-
von Glahn, Uwe H., Gelder, Thomas F., and Smyers, William H., Jr.: A Dye-Tracer Technique for Experimentally Obtaining Impingement Characteristics of Arbitrary Bodies and a Method for Determining Droplet Size Distribution. NACA-TN-3338, 1955. ntrs.nasa.gov
-
Gelder, Thomas F., Smyers, William H., Jr., and von Glahn, Uwe H.: Experimental Droplet Impingement on Several Two-Dimensional Airfoils with Thickness Ratios of 6 to 16 Percent. NACA-TN-3839, 1956. ntrs.nasa.gov
- Brun, Rinaldo J., and Vogt, Dorothea E.: Impingement of Water Droplets on NACA 65A004 Airfoil at 0° Angle of Attack. NACA-TN-3586, 1955. ntrs.nasa.gov
- Brun, Rinaldo J., Gallagher, Helen M., and Vogt, Dorothea E.: Impingement of Water Droplets on NACA 65A004 Airfoil and Effect of Change in Airfoil Thickness from 12 to 4 Percent at 4° Angle of Attack. NACA-TN-3047, 1953. ntrs.nasa.gov
- Brun, Rinaldo J., Gallagher, Helen M., and Vogt, Dorothea E.: Impingement of Water Droplets on NACA 65A004 Airfoil at 8° Angle of Attack. NACA-TN-3155, 1954. ntrs.nasa.gov
- von Glahn, Uwe H.: Use of Truncated Flapped Airfoils for Impingement and Icing Tests of Full-Scale Leading-Edge Sections. NACA-RM-E56E11, 1956. ntrs.nasa.gov
- Gray, Vernon H., and von Glahn, Uwe H.: Effect of Ice and Frost Formations on Drag of NACA 651-212 Airfoil for Various Modes of Thermal Ice Protection. NACA-TN-2962, 1953. ntrs.nasa.gov
- Jacobs, Eastman N.: Airfoil Section Characteristics as Affected by Protuberances. NACA-TR-446, 1932 ntrs.nasa.gov.
- Bowden, Dean T.: Effect of Pneumatic De-Icers and Ice Formations on Aerodynamic Characteristics of an Airfoil. NACA-TN-3564, 1956. ntrs.nasa.gov
NACA-TN-4151 is cited 3 times in the NACA Icing Publications Database5
- Gray, Vernon H., and von Glahn, Uwe H.: Aerodynamic Effects Caused by Icing of an Unswept NACA 65A004 Airfoil. NACA-TN-4155, 1958. ntrs.nasa.gov
- Gelder, Thomas F.: Droplet Impingement and Ingestion by Supersonic Nose Inlet in Subsonic Tunnel Conditions. NACA-TN-4268, 1958. ntrs.nasa.gov
- Gray, Vernon H.: Prediction of Aerodynamic Penalties Caused by Ice Formations on Various Airfoils. NASA-TM-D-2166, 1964. archive.org
An online search 6 found 34 citations of NACA-TN-4151.
NACA-TN-4155 cites 12 publications:
- Gray, Vernon H., and von Glahn, Uwe H.: Effect of Ice and Frost Formations on Drag of NACA 651-212 Airfoil for Various Modes of Thermal Ice Protection. NACA-TN-2962, 1953. ntrs.nasa.gov
- von Glahn, Uwe H., and Gray, Vernon H.: Effect of Ice Formations on Section Drag of Swept NACA 63A-009 Airfoil with Partial-Span Leading-Edge Slat for Various Modes of Thermal Ice Protection. NACA-RM-E53J30, 1954. ntrs.nasa.gov
- Bowden, Dean T.: Effect of Pneumatic De-Icers and Ice Formations on Aerodynamic Characteristics of an Airfoil. NACA-TN-3564, 1956. ntrs.nasa.gov
- Brun, Rinaldo J., Gallagher, Helen M., and Vogt, Dorothea E.: Impingement of Water Droplets on NACA 65A004 Airfoil and Effect of Change in Airfoil Thickness from 12 to 4 Percent at 4° Angle of Attack. NACA-TN-3047, 1953. ntrs.nasa.gov
- Gray, Vernon H.: Correlations Among Ice Measurements, Impingement Rates, Icing Conditions and Drag Coefficients for an Unswept NACA 65A004 Airfoil. NACA-TN-4151, 1958. ntrs.nasa.gov
- Perkins, Porter J., McCullough, Stuart, and Lewis, Ralph D.: A Simplified Instrument for Recording and Indicating Frequency and Intensity of Icing Conditions Encountered in Flight. NACA-RM-E51E16, 1951. ntrs.nasa.gov
- Gelder, Thomas F., Smyers, William H., Jr., and von Glahn, Uwe H.: Experimental Droplet Impingement on Several Two-Dimensional Airfoils with Thickness Ratios of 6 to 16 Percent. NACA-TN-3839, 1956. ntrs.nasa.gov
- Goett, Harry J.: Experimental Investigation of the Momentum Method for Determining Profile Drag. NACA-TR-660, 1939. ntrs.nasa.gov
- Block, Myron J., and Katzoff, S.: Tables and Charts for the Evaluation of Profile Drag from Wake Surveys at High Subsonic Speeds. NACA-WR-L-107, 1945. (Supersedes NACA-RB-L5F15a.) ntrs.nasa.gov
- Allen, H. J., and Vincenti, Walter G.: Wall Interference in a Two-Dimensional-Flow Wind Tunnel with Consideration of the Effect of Compressibility. NACA-TR-782, 1944. (Supersedes NACA-ARR-4K03.) ntrs.nasa.gov
- Spreeman, Kenneth P.: Experimental Investigation at High Subsonic Speeds of the Effects of Leading-Edge Radius on the Aerodynamic Characteristics of a Sweptback-Wing - Fuselage Combination with Leading-Edge Flaps and Chord-Extensions. NACA-RM-L55E25a, 1955. ntrs.nasa.gov
- McCullough, George B., and Gault, Donald E.: Boundary-Layer and Stalling Characteristics of the NACA 64A006 Airfoil Section. NACA-TN-1923, 1949. ntrs.nasa.gov
NACA-TN-4155 is cited 3 times in the NACA Icing Publications Database5
- Gray, Vernon H.: Correlations Among Ice Measurements, Impingement Rates, Icing Conditions and Drag Coefficients for an Unswept NACA 65A004 Airfoil. NACA-TN-4151, 1958. ntrs.nasa.gov
- Gray, Vernon H.: Prediction of Aerodynamic Penalties Caused by Ice Formations on Various Airfoils. NASA-TM-D-2166, 1964. archive.org
An online search 7 found 38 citations of NACA-TN-4155.
Notes
-
Gray, Vernon H.: Correlations Among Ice Measurements, Impingement Rates, Icing Conditions and Drag Coefficients for an Unswept NACA 65A004 Airfoil. NACA-TN-4151, 1958. ntrs.nasa.gov ↩
-
Gray, Vernon H., and von Glahn, Uwe H.: Aerodynamic Effects Caused by Icing of an Unswept NACA 65A004 Airfoil. NACA-TN-4155, 1958. ntrs.nasa.gov ↩
-
Jacobs, Eastman N.: Airfoil Section Characteristics as Affected by Protuberances. NACA-TR-446, 1932 ntrs.nasa.gov. ↩
-
Messinger, B. L.: Equilibrium Temperature of an Unheated Icing Surface as a Function of Airspeed. Preprint No. 342, Presented at I.A.S. Meeting, June 27-28, 1951. ↩