There was remarkable progress in the three-year span 1946 through 1949.
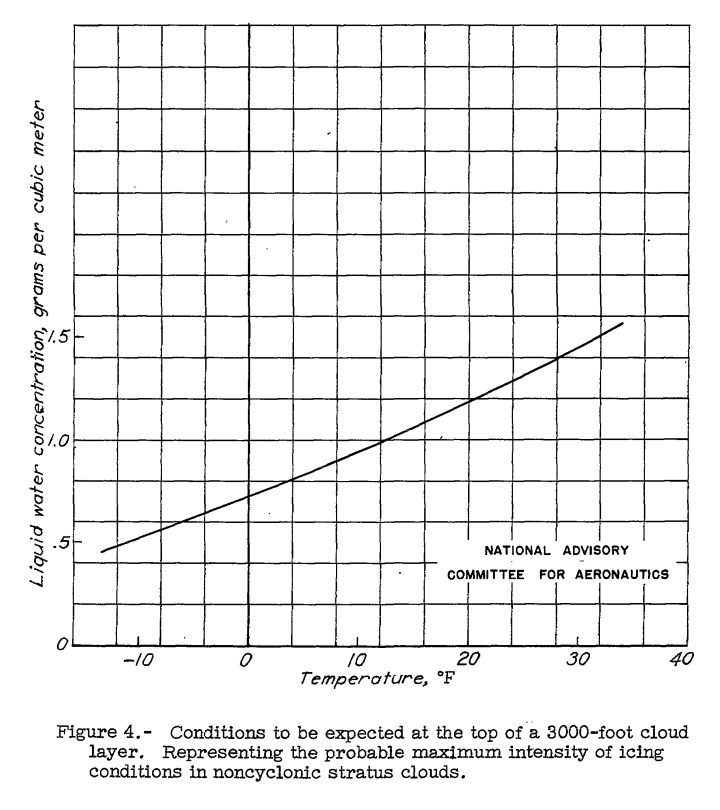
from "FLIGHT INVESTIGATION OF METEOROLOGICAL FACTORS CONDUCIVE TO AIRCRAFT ICING", William Lewis, 1947. 1
Summary
The most enduring legacy of the NACA publications on icing meteorology is their direct influence on the current icing regulations.
Key Points
- NACA publications contributed heavily to the creation of the Appendix C icing regulation.
- The key flight tests and publications were complete by 1952.
- Some engineering judgement went into creating the icing regulation.
- There was remarkable progress in the three-year span 1946 through 1949.
- The data from 1949 compares well to more recent flight test measurements.
Discussion
The most enduring legacy of the NACA publications on icing meteorology is their direct influence on the current icing regulations.
Icing Regulations and NACA publications
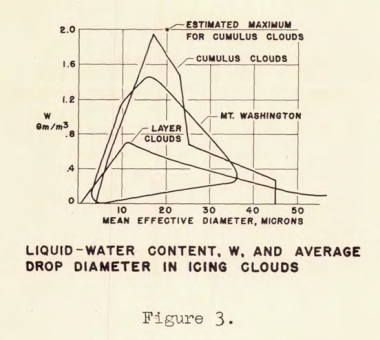
A limited understanding of atmospheric icing conditions was achieved by 1945. NACA-TN-1246 (1947) notes a "Mt. Washington Weather Bureau meeting on June 19, 1945" that had some recommended values:
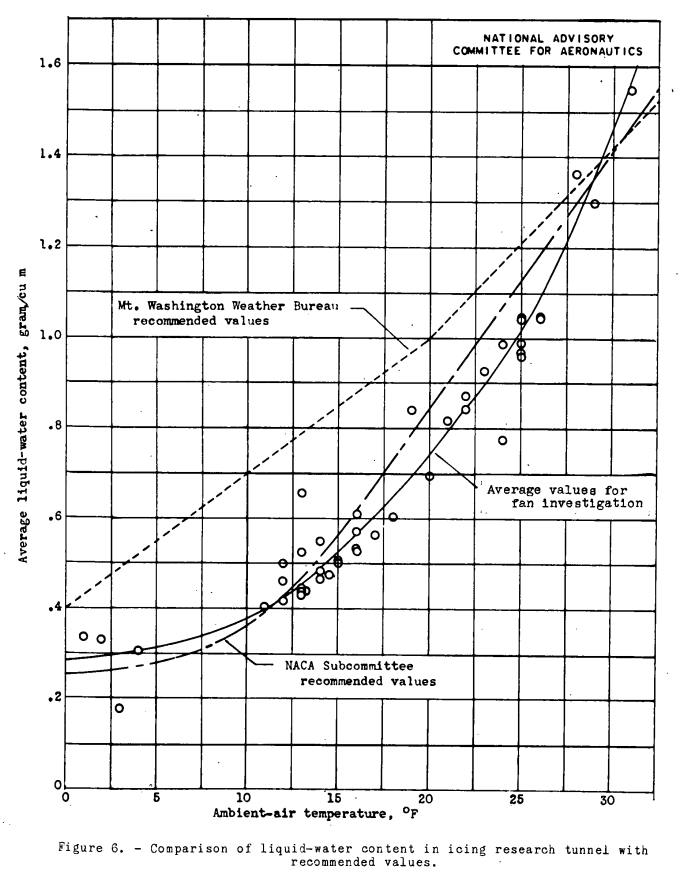
Calibration of tunnel-icing conditions. - The icing conditions were defined by the ambient-air temperature and liquid-water content of the air. Figure 6 presents the variation of liquid-water content with air temperature at the face of the cooling fan as determined by a survey conducted in the diffuser section of the icing research tunnel and a comparison of these conditions with the values recommended by the NACA Subcommittee on De-Icing Problems and by the Mt. Washington Weather Bureau meeting on June 19, 1945. The subcommittee values are one-half of the recommended maximum values and are for average or typical icing.
More data was available by 1947 to refine the estimates, in NACA-TN-1391, NACA-TN-1392, NACA-TN-1393, and NACA-TN-1424.
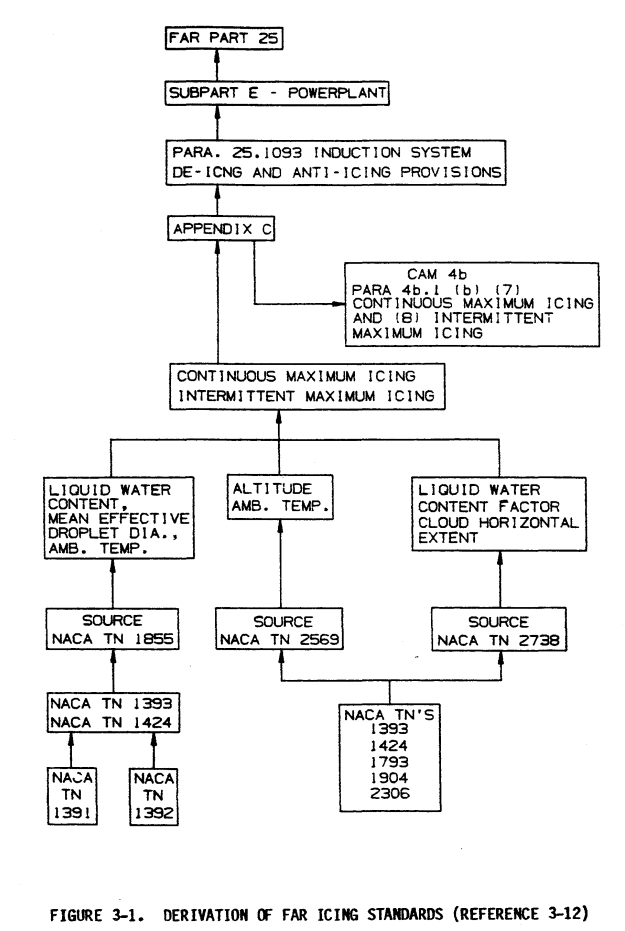
As we saw in the Conclusions Meteorological Instruments Thread, only a limited number of NACA publications went directly into determining the current Appendix C icing requirements 3.
[As we saw in Conclusions of the Cylinder Thread, it is not entirely clear where this figure originally came from.]
Thus, by the time NACA-TN-2738 was published in 1952, all pertinent icing data had been obtained.
Also note that perhaps the most import part, NACA-TN-1855, was complete by 1949.
There were later icing tests and publications (see particularly those by Porter Perkins, mentioned in Meteorology of Icing Clouds). However, they did not appear to have directly influenced the icing regulations.
The process of reaching the current icing regulations in the figure above might appear straight-forward, but engineering judgement was applied at several steps along the way.
Some comments on the regulations
Jeck 4 discusses the Appendix C drop size boundaries:
Origins of the "Icing Envelopes" in FAR-25, Appendix C
Information printed on figures 1 and 4 of FAR-25, Appendix C states that NACA report TN-1855 (Jones and Lewis, 1949) is the source of data for these envelopes. Within TN-1855 the reader is referred to two earlier reports, TN-1393 (Lewis, 1947) and TN-1424 (Lewis et al., 1947) for the actual data on which the "continuous maximum" envelopes are based. Both TN-1393 and TN-1424 show numerous observations of MVDs in the range 7 to 15 μm. In fact, figure 6 of TN-1424 contains a probability curve which shows that 50% of the observed MVDs are smaller than 13 micrometer! None of these references contain any obvious statements that 15 micrometer was viewed as the minimum MVD worth consideration.
However, such conclusions may have arisen implicitly from the discourse in TN-1393 on the subject of icing forecast problems. On page 16 of that report, it is proposed that a fixed MVD of 14 μm be assumed for layer clouds in order to simplify the problem of specifying icing intensities from a knowledge of cloud type and estimated LWC alone. Also, in a later section (page 22 of TN-1393) dealing with maximum, continuous LWCs that are likely to occur in layer clouds, a value of micrometer μm is proposed as a reasonable estimate for MVDs to be expected concurrently with continuous maximum LWCs of 0.8 g/m3. The authors then point out that LWCs of 0.5 g/m3 along with MVDs of 25 μm should be considered as a definite probability in layer clouds too. These conclusions, coupled with a recollection (page 7 of TN-1393) that severe icing was observed on the windshield of their C-46 research aircraft with only 0.15 g/m^3 of LWC when the MVD was an unusually large 50 μm, apparently led the author to stress the potential importance of the larger MVDs because of the greater collection efficiencies associated with them.
So, not all the choices made in creating the current icing standards have had obvious logic.
Also see Jeck, 2008 5 for more comments.
Another choice made in creating the icing standards was not including freezing rain.
Freezing Rain
For the NACA-TN-1855 class "IV - M Freezing Rain", a similar requirement was not incorporated into Appendix C. The assumption was apparently that if equipment was protected for other classes of icing, then performance might be adequate in freezing rain. Status pressure ports were the only equipment listed to be considered against freezing rain. It was not until 2014 that freezing rain requirements were incorporated into the new Appendix O of CFR 14 Part 25 6.
Change from "Duration" to "Distance" to "Extent" in icing
The nomenclature changed from "Duration":
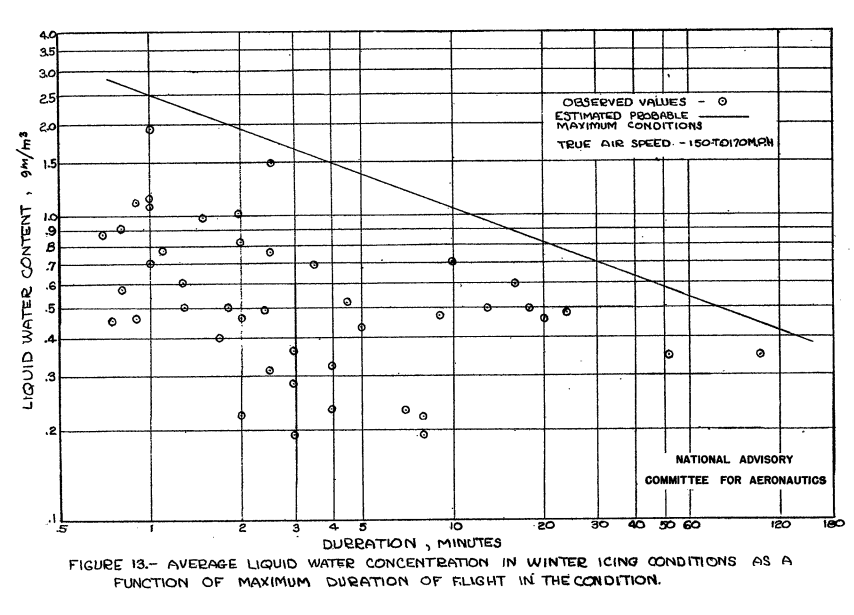
To "Distance":
To "Extent" (on the X-axis label, however, note that the figure title says "Distance"):
This change was not explained. It is not clear if it was editorial, or if some subtle technical difference was implied. The "distance" in the figure title implies to me that "extent" was an editorial choice or error, not a technical, data driven choice.
NACA-TN-2738 uses "Extent":
The Appendix C regulation uses "Extent":

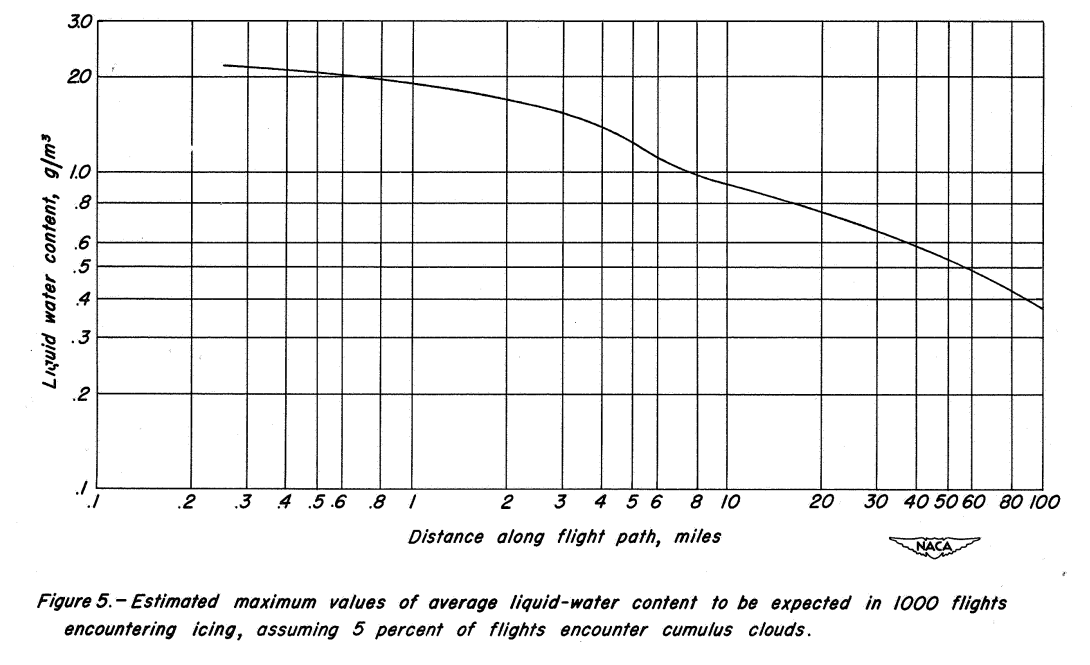
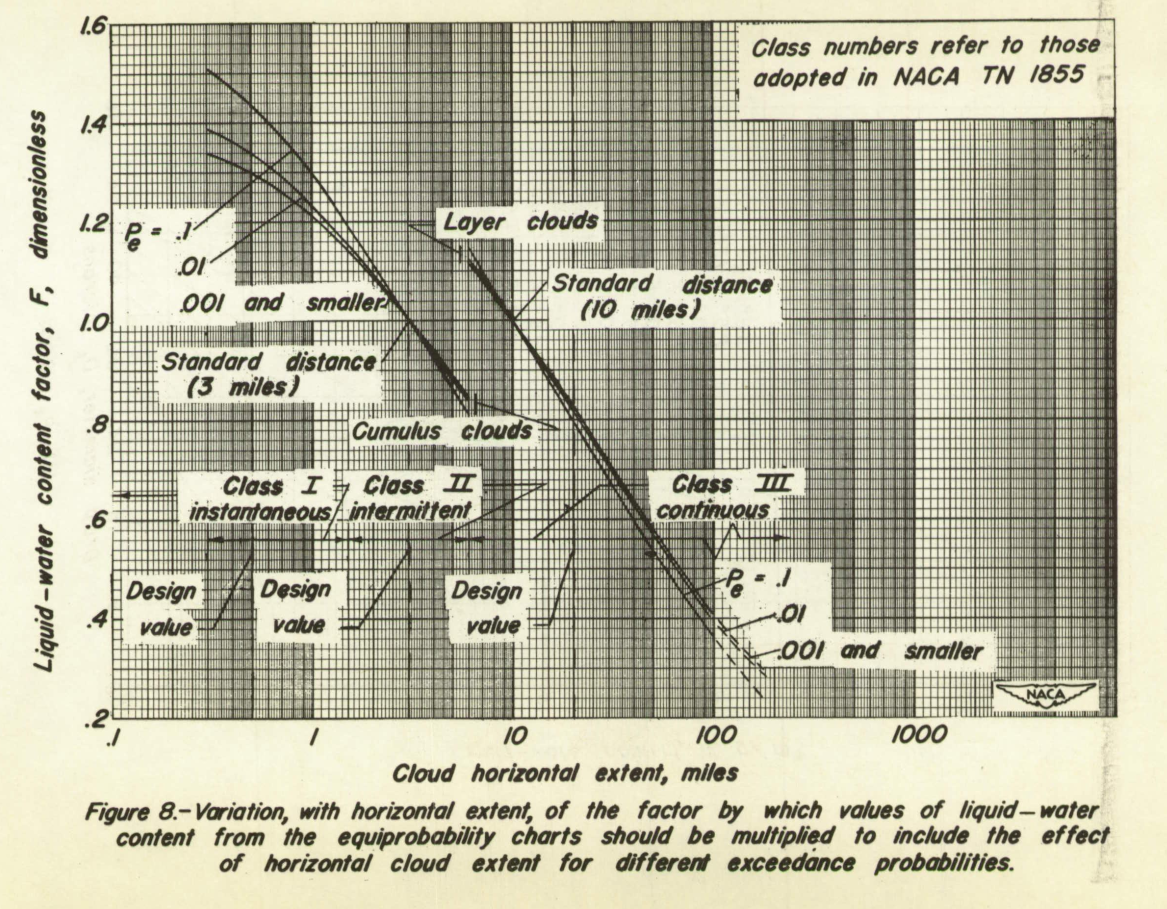
The various distance effects are hard to directly compare, as some are shown as a liquid-water content values, and some as a liquid-water content factors. Also, linear, log-linear, and log-log plots are used, with different units for distance or duration. Perhaps in a future post (maybe even a thread) we will sort through all that, but for now I will say that they are surprising similar in some regards.
While the nomenclature change may seem to be minor, there is an effect on interpretation of the regulation. AC 20-73 describes an assumption about an extended duration (45 minute) hold in icing.
Another use is to estimate ice buildups on unprotected surfaces during a 45-minute hold. For the 45-minute hold discussed in section 8 of this AC, use the LWC from Figure 1 of 14 CFR part 25, Appendix C at full value. Guidance for the 45-minute hold assumes the conservative case when the holding pattern remains within 17.4 nm and the LWC is changed from that shown in Figure 1 of 14 CFR part 25, Appendix C.
The distance traveled during a 45-minute hold for a large transport would be much greater than 17.4 nautical miles, resulting in a Liquid Water Content Factor of less than 1, but the recommendation above is to use a value of 1 anyway.
Drop size distributions
The accuracy of the multicylinder instrument for determining drop size distribution was questioned several times (see, for example, NACA-TN-1904).
I have not seen direct comparisons between a multicylinder and more current instruments that can provided detailed drop size spectrum data.
The multicylinder instrument drop size distribution determination depends on natural icing distributions to be something like the idealized Langmuir drop size distributions. For at least some cases, this is true. See Conclusions of the Cylinder Thread.
Nonetheless, advisory material still suggests the use of Langmuir distributions 7.
NACA-TN-1855 suggested research tasks
NACA-TN-1855 suggested six research task to confirm its recommendations. These were largely accomplished in NACA-TN-2738.
However, I could not find if two of the tasks were accomplished:
3. Obtain flight data to establish drop—size distribution
   in clouds.
4. Obtain necessary data in flight through icing clouds for
   confirmation or modification of the method of assuming adiabatic
   lifting and no mixing for the calculation of liquid-water content
   at any level in a cloud.
Several instruments were assessed in the NACA-era (see the Meteorological Instruments Thread). However, none proved to be a satisfactory alternative to the multicylinder method for determining drop-size distributions. The best alternative at the time was perhaps some form of water drop imaging, but it would be decades before that was a practical alternative.
Appendix C does not mention drop-size distribution. Advisory Circular AC 20-73A 7 does include the Langmuir drop size distributions, and recommends the use of a D distribution.
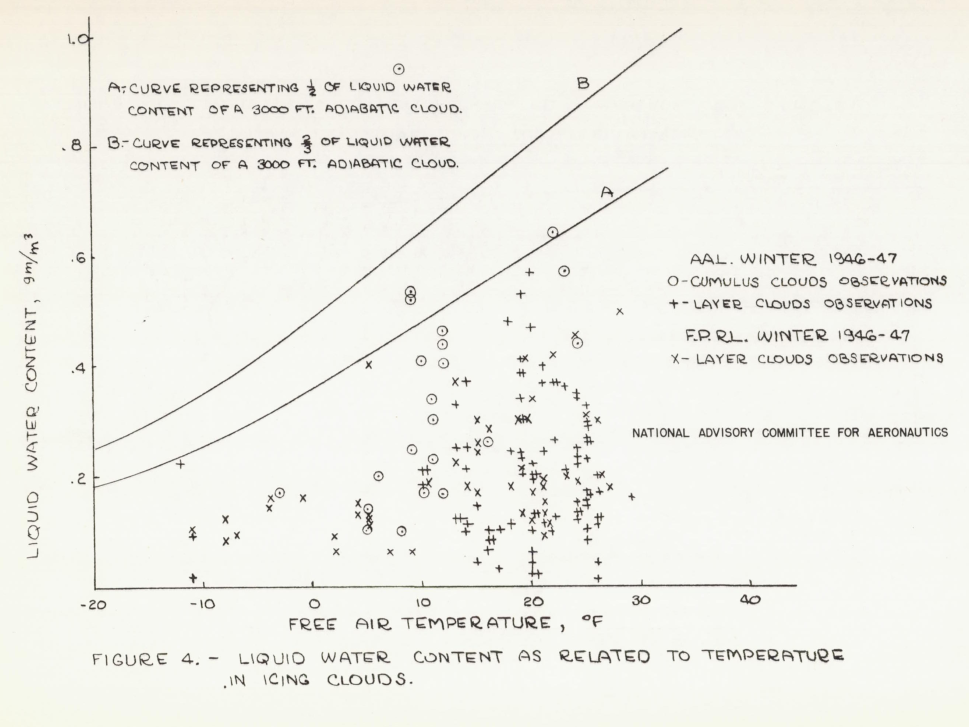
While I did not find a further evaluation of adiabatic lift theory, note that the earlier NACA-TN-1424 figure 4 (shown further below) compares an ideal calculation to one that assumes 1/2 or 2/3 of the water condenses, and the 1/2 assumption appears to fit layer-type cloud data better. Adiabatic lift theory is still used today to estimate maximum cloud liquid water content. However, for the simple implementation, the results are often conservatively high compared to measured data. I suppose that current weather modelling is a much more sophisticated implementation of adiabatic lift theory (and a lot of other physics), but it is still challenged to calculate accurate LWC values.
Tracking changes in the understanding of LWC values
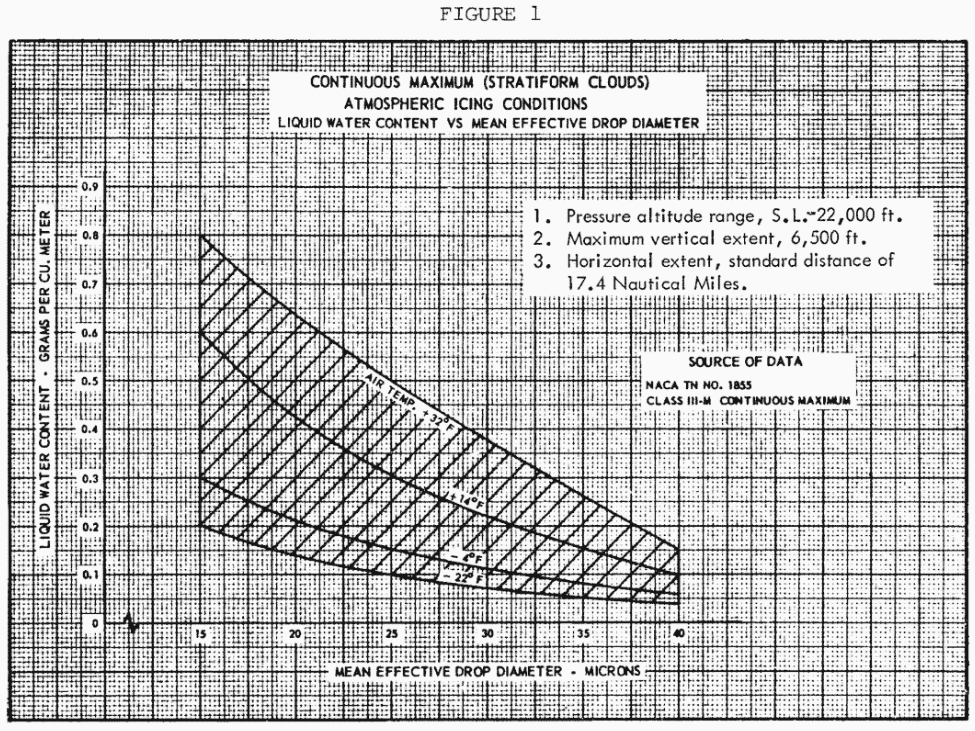
As an example of how the understanding of liquid water content (LWC) changed over the NACA-era, we will take an example point from Appendix C Figure 1 for "Continuous Maximum (Stratiform Clouds)".
- Temperature = 32F, MVD = 15 micrometer, LWC = 0.8 g/m^3 (17.4 nmi extent)
(upper left corner of the envelope).
We find similar cases in prior publications:
NACA-TN-1391 (1947):
- LWC = 1.5 g/m^3 (no drop size information)
NACA-TN-1393 (1947):
- 0.8 g/m^3 (no drop size information, estimated for 20 minute (53 mile) distance)
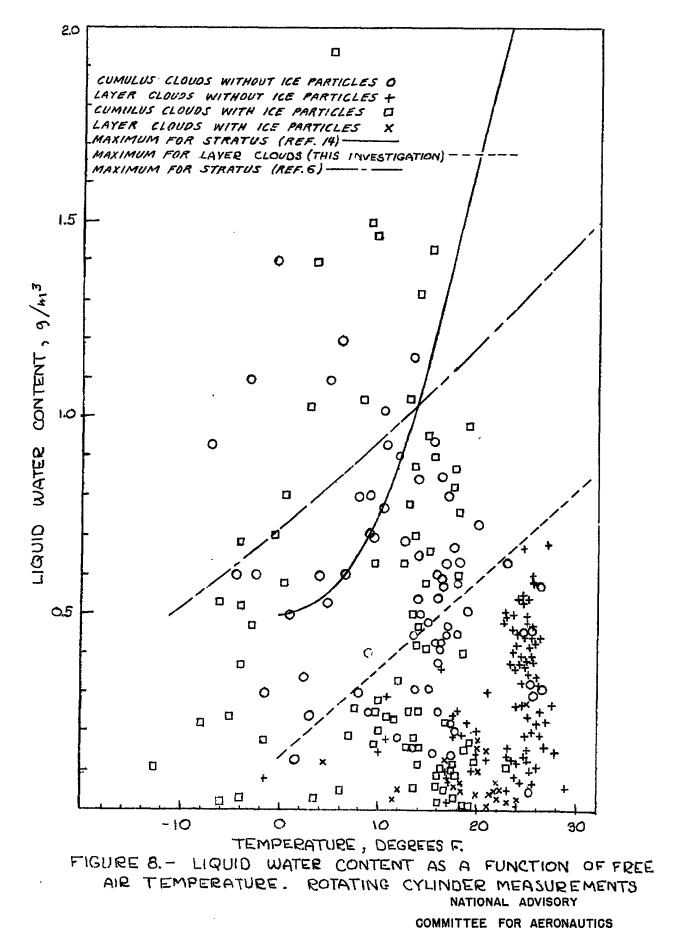
Reference 6 is NACA-TN-1391.
Reference 14 is Rodert 8.
Rodert (1946):
- 3.0 g/m^3, 30 micrometer (From Table 2 of 8, distance not noted)
Rodert notes that:
The values given in Table 2 are established by a faired line which has been drawn on a graphical presentation of weather-bureau data. The faired curve was drawn so as to give values which in all cases exceed the data thus far observed and therefore probable. Our knowledge of the weather is obviously inadequate.
NACA-TN-1424 (1947):
- Calculation A: 1.0 g/m^3 (no drop size information, duration or distance not noted)
- Calculation B: 0.8 g/m^3 (no drop size information, duration or distance not noted)
NACA-TN-1855 (1949):
- Table 1, III-M Continuous Maximum 0.8 g/m^3, 15 micrometer, distance not noted
In a table sorted by publication order:
| Source | Year | LWC, g/m^3 |
|---|---|---|
| Rodert | 1946 | 3.0 |
| NACA-TN-1391 | 1947 | 1.5 |
| NACA-TN-1393 | 1947 | 0.8 (53 miles) |
| NACA-TN-1424 A | 1947 | 1.0 |
| NACA-TN-1424 B | 1947 | 0.8 |
| NACA-TN-1855 | 1949 | 0.8 |
Different implementations of theory had differing values. By 1949, interpretations of test data had arrived at the values in Appendix C. There was remarkable progress in the three-year span 1946 through 1949.
For yet another data point from 1947, see the Conclusions below.
Recent data comparison to Appendix C
More recent icing data with more recent instrumentation compares well to the 70+ year-old NACA data.
Figure 1 of Cober and Isaac 9 is one example. It is copy-righted, but available on-line. While not every data point is within the Appendix C envelope, the differences have not been viewed as large enough to require revising the Appendix C regulation.
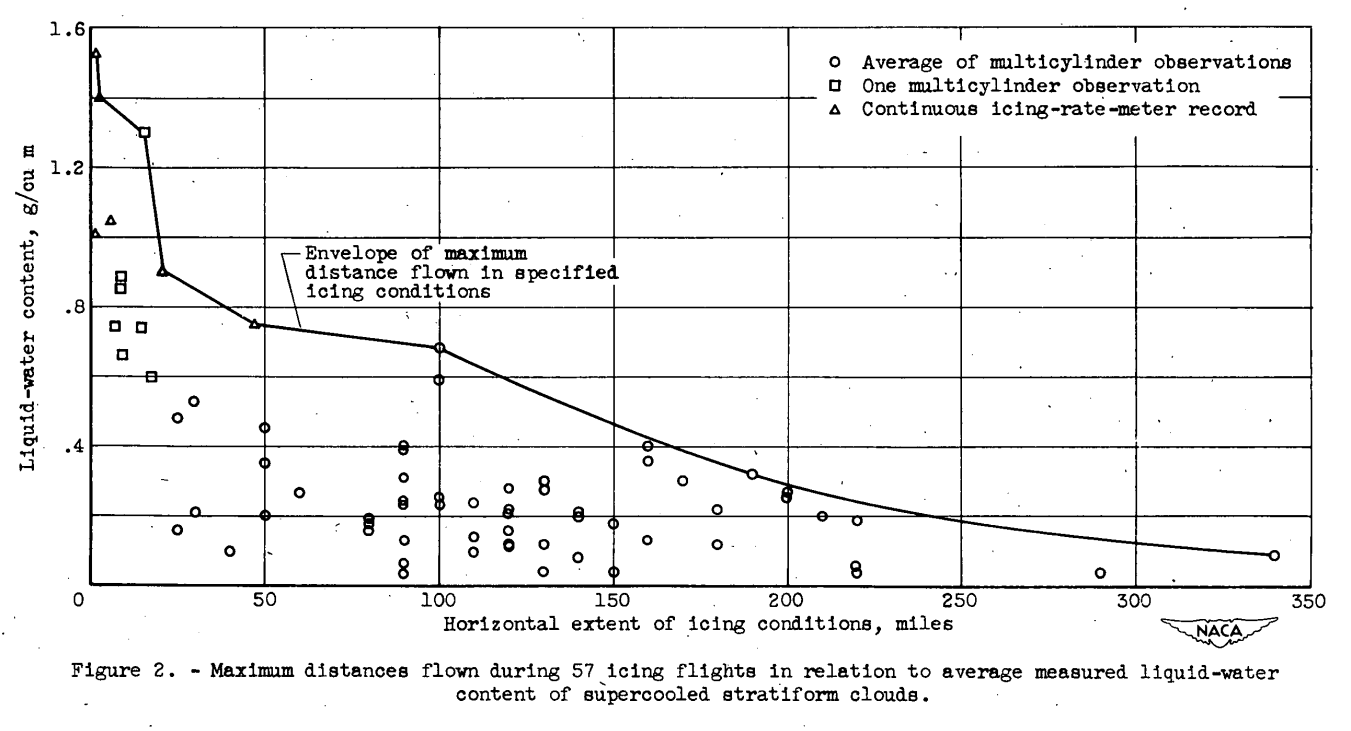
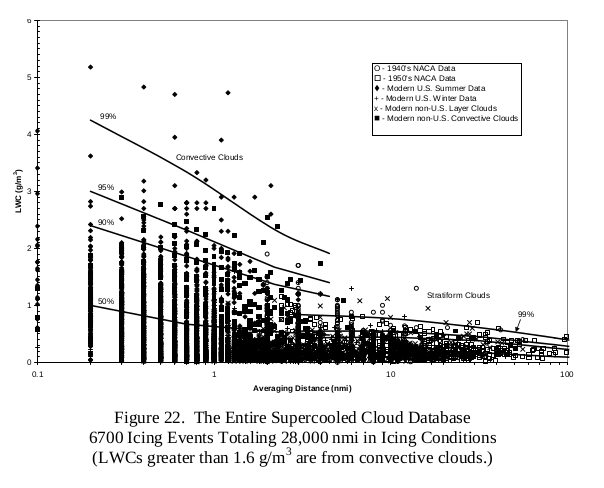
Also see Jeck, 2008 5, for results from a database with 28,000 nmi of flight in icing data, including NACA-era measurements. There are many comparisons that include NACA data, many on a distance basis as in Figure 22 below. Jeck also includes proposed revisions to the icing envelopes (that no one has adopted, as far as I know).
Conclusions
The current Appendix C icing regulations are largely based on NACA flight tests and publications that were completed by 1952.
The data and recommendations from the NACA-era have held up remarkably well. The Continuous Maximum Icing part of Appendix C has not been revised since CAR 4b 10 was published in 1955, and later incorporated into Appendix C 2.
In 1947, William Lewis wrote 1:
The meteorological conditions conducive to aircraft icing which are considered to be of most interest to the designer of thermal ice-prevention equipment are summarized in table I. The two cases are selected of "most probable maximum" and "typical or normal" icing conditions. The drop-size distribution has not been specified in the table but may be considered uniform for these conditions. In addition to the two conditions specified in the table, however, the designer should give consideration to the possibility of encountering drop sizes larger than 35 microns, although with corresponding low liquid-water content.
As a general conclusion, it is believed that the meteorological factors of icing conditions have been sufficiently defined to allow the design of thermal ice-prevention equipment on a fundamental wet-air basis.
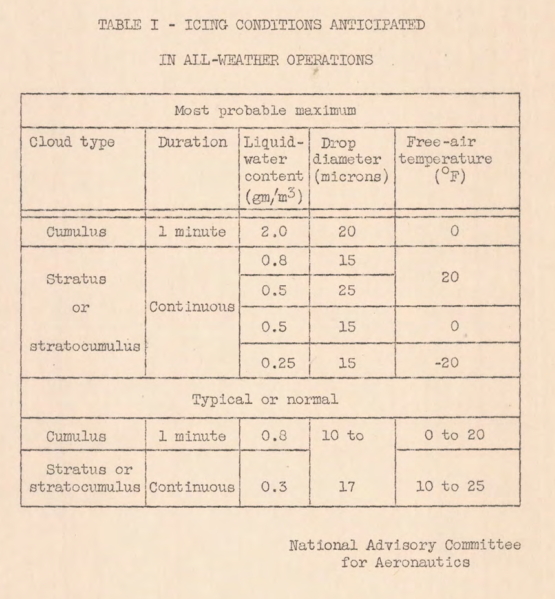
We can compare the Continuous Maximum values from Table I to Appendix C, Figure 3 values:
| Temperature, F | Drop diameter, micrometer | Lewis Most Probable Continuous Maximum LWC, g/m^3 | Appendix C Figure 3 LWC, g/m^3 |
|---|---|---|---|
| 20 | 15 | 0.8 | 0.67 (0.8 @ 32F) |
| 20 | 25 | 0.5 | 0.37 (0.5 @ 32F) |
| 0 | 15 | 0.5 | 0.34 |
| -20 | 15 | 0.25 | 0.21 |
They are not identical, but I would call them "close enough" to be "to be of most interest to the designer of thermal ice-prevention equipment" (having designed and tested several thermal systems myself), particularly if one had been using the value from Rodert in 1946 8 of 3 g/m^3.
As William Lewis said in 1969 11:
In conclusion, we have reviewed the icing criteria used in the design and certification of transport aircraft. Although these standards are now twenty years old, they are generally consistent with data that have become available since their adoption. Since these criteria have stood the test of use, and since the total of experience with existing aircraft is more comprehensive than any data collecting program, it is suggested that future changes in criteria be based primarily on operating experiences rather than on meteorological data.
So far, operating experiences have not required a change to Appendix C Continuous Maximum Icing (However, the new Appendix O was published in 2014 6, and recall Lewis's note in 1947 "the designer should give consideration to the possibility of encountering drop sizes larger than 35 microns").
There was remarkable progress in the three-year span 1946 through 1949. Several factors had come together to make that possible. A vital need was recognized. Multiple agencies were coordinated (NACA, Army Air Force, Weather Bureau, industry, academia). Test aircraft with robust ice protection were available (see Engine Exhaust Heat). Improved icing instruments were being developed.
The icing design requirements are another crowning achievement of the NACA-era.
Related
The next thread in the NACA review series is the University of Michigan Airplane Icing Information Course.
Notes
-
Lewis, William: "FLIGHT INVESTIGATION OF METEOROLOGICAL FACTORS CONDUCIVE TO AIRCRAFT ICING", NACA Conference on Aircraft Ice Prevention A Compilation of Papers Presented by NACA Staff Members. 6505/NACA-1947/8, 1947. apps.dtic.mil ↩↩
-
“Airworthiness Standards: Transport Category Airplanes”, CFR 14, Part 25, Appendix C, Washington, DC, 2021 Appendix C ecfr.gov ↩
-
“Aircraft Icing Handbook Volume 1.” DOT/FAA/CT-88/8-1 (1991) apps.dtic.mil.
Also note that there was a perhaps little known update in 1993 (that did not affect the pages of interest herein): apps.dtic.mil. ↩↩ -
Jeck, Richard K: "A new database of supercooled cloud variables for altitudes up to 10,000 feet AGL and the implications for low altitude aircraft icing", DOT/FAA/CT-83/21, 1983. tc.faa.gov ↩
-
Jeck, Richard K. "Advances in the characterization of supercooled clouds for aircraft icing applications". No. DOT-FAA-AR 07-4. Office of Aviation Research and Development, Federal Aviation Administration, 2008. tc.faa.gov ↩↩
-
FAA Advisory Circular AC No. 20-73A: Aircraft Ice Protection. August 16, 2006. faa.gov ↩↩
-
Rodert, Lewis A.: Some Suggested Specifications for Thermal Ice-Prevention System for Aircraft. Trans. ASME vol. 68 no. 7, October, 1946, pp. 781-789. ↩↩↩
-
Cober, Stewart, and Isaac, George: "Estimating Maximum Aircraft Icing Environments Using a Large Database of In-Situ Observations." 44th AIAA Aerospace Sciences Meeting and Exhibit. 2006. Research Gate ↩
-
"AIRPLANE AIRWORTHINESS - TRANSPORT CATEGORIES MISCELLANEOUS AMENDMENTS", Civil Air Regulations Amendment 4b-2, July, 1955. stacheair.com ↩
-
Lewis, William: "Review of Icing Criteria", in "Aircraft Ice Protection", the report of a symposium held April 28-30, 1969, by the FAA Flight Standards Service; Federal Aviation Administration, 800 Independence Ave., S.W., Washington, DC 20590. apps.dtic.mil. ↩