"Thanks are also due ... for their patience and support on this long project." 1
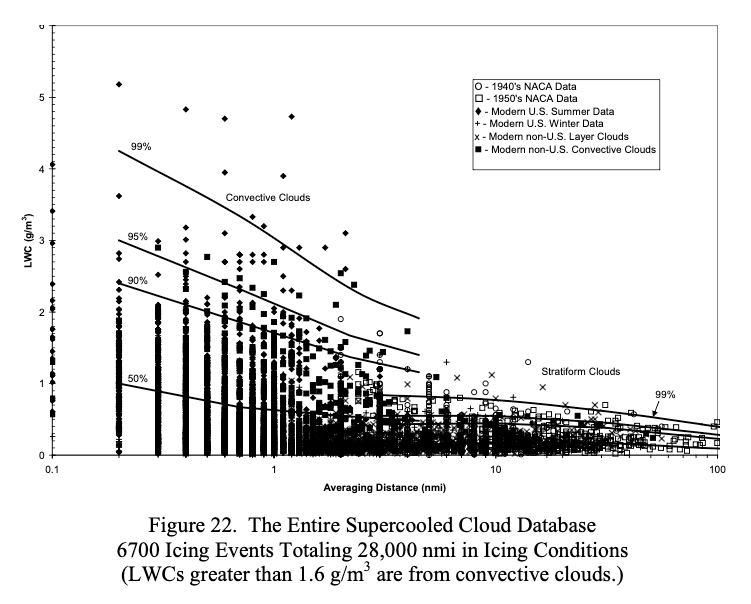
Public Domain image from DOT/FAA/AR-07/4.
Introduction
There are 28000 nmi of measured natural icing flight test data in the database, with over 6000 individual measurements. Data from more than two dozen organizations for flights between 1946 and 1988 (42 years) were collected into the database.
Dr. Richard Jeck of the FAA was the lead in assembling the database.
Dr. Jeck used the term "Supercooled Cloud Database", so here we will abbreviate that to Database or SCDB.
The database took at least 14 years to assemble.
Early Motivations for the Database
Nearly of the database (14,372 nmi out of 28,000) of the Database already existed before Dr. Jeck started: The inflight icing data from the NACA-era. That data was the basis of the current Appendix C icing environment definitions. See Conclusions of the Meteorology of Icing Clouds Thread.
However, there would be much work collecting and putting the NACA data into a format compatible with the database of more recent measurements. This was apparently not completed until circa 1994.
Early motivations for the database were driven by the helicopter community 2:
This is a report of accomplishment in response to a growing requirement over the past decade for a new assessment of aircraft icing conditions in wintertime clouds at altitudes up to about 10,000 feet. The requirement has been documented in past workshops [1-5], and comes primarily from the helicopter community which wants ice-protected rotorcraft to meet increasing demands for “all-weather” operations. Currently, only a few of the larger helicopters are equipped with certification of ice-protection devices. This is because the current FAA criteria for design and certification of ice-protection equipment results in power and payload penalties that smaller rotorcraft cannot tolerate.
The FAA criteria (promulgated in the Federal Aviation Regulations, Part 25 (FAR-25, Appendix C) were actually designed for large, transport-category aircraft capable of flying to 20,000 feet or more. For this reason, there have been concerns that the current criteria may be too severe for low-performance aircraft, such as helicopters, which generally operate at altitudes below 10,000 feet.
Early publications include:
- "Icing Characteristics of Low Altitude, Supercooled Layer Clouds." 1980 3
- "A New Data Base of Supercooled Cloud Variables for Altitudes up to 10,000 Feet AGL (Above Ground Level) and the Implications for Low Altitude Aircraft Icing" 1983 (notes 7000 nmi of data) 4
- "The Aircraft Icing Environment in Wintertime, Low Ceiling Conditions." 1985 5
- "A new characterization of the icing environment below 10,000 feet AGL from 7,000 miles of measurements in supercooled clouds" 1985 2
- "Aircraft icing environment in low ceiling conditions near Washington, DC." 1987 6
- "A New Characterization of Supercooled Clouds Below 10,000 Feet AGL" 1988 7
- "Selecting representative test points for icing conditions using the new faa/nrl database" 1989 8
The Assembled Database
The full database was described in "Other ways to characterize the icing atmosphere" 9 (1994).
The motivation for the database is described:
Over the past several years, a computerized database of some 28,000 nmi of inflight measurements of icing conditions has been assembled at the FAA Technical Center.
At the present time, the only quantitative descriptions of icing conditions aloft are those generated by civil aviation authorities or by military design bureaus. These organizations need them as engineering design criteria for ice protection equipment on aircraft. These criteria simply specify the maximum expected values of LWC as a function of temperature and cloud droplet size in clouds above the freezing level. In the U.S. these descriptions are found in Appendix C of the Federal Aviation Regulations, Parts 25 and 29 (FAR-25 and FAR-29). Figure 1 shows the criteria for stratiform clouds. This graphical presentation is often called a characterization, and the limiting curves are often referred to as design envelopes.
Although this existing characterization has served for selecting design values of LWC, it has some self-limiting features which hamper its wider use. It is in the spirit of exploring alternate ways of describing icing conditions, and attempting to overcome some of these limiting features, that this paper is presented. This paper is therefore for the purpose of information exchange only, and to relate some of the insight that has been gained by exploring alternate approaches.
Few noticed, or at least few cited this work (although Dr. Jeck would cite it in his later publications). I found only one citation at scholar.google.com. It was "Contributions to Image Transmission in Icing Conditions on Unmanned Aerial Vehicles" in 2023, 29 years [!] after the publication of "Other Ways ...", and only briefly mentions it. I view this as under-appreciated for the announcement of a great technical achievement.
Fortunately, Dr. Jeck's later works on this topic have gotten (and still get) noticed.
Detailed analysis using the Database
Later publications that utilized the database were:
- "Icing Design Envelopes (14 CFR Parts 25 and 29, Appendix C) Converted to a Distance-Based Format" 2002. 10
- "Advances in the Characterization of Supercooled Clouds for Aircraft Icing Applications". 2008. 1
- "Distance-Scaled Water Concentrations versus Mass-Median Drop Size, Temperature, and Altitude in Supercooled Clouds". 2008 11
"Icing Design Envelopes (14 CFR Parts 25 and 29, Appendix C) Converted to a Distance-Based Format" included this note:
NOTICE
...
This document does not constitute FAA certification policy. Consult your local FAA aircraft certification office as to its use.
However, the FAA Advisory Circular AC 20-73A (2006) 12 referenced the Dr. Jecks publications in three sections, and include some of his figures:
APPENDIX M. FINDING NATURAL ICING CONDITIONS FOR TEST PURPOSES
M1. “Icing Design Envelopes (14 CFR-25, 29, Appendix C) Converted to a Distance-Based Format,” Richard K. Jeck, FAA Technical Report DOT/FAA/AR-00/30 (2000), FAA William J. Hughes Technical Center, Atlantic City International Airport, NJ 08405.
M2. “A New Database of Supercooled Cloud Variables for Altitudes up to 10,000 Feet AGL and the Implications for Low Altitude Aircraft Icing,” Richard K. Jeck, FAA Technical Report DOT/FAA/CT-83/21 (1983), FAA William J. Hughes Technical Center, Atlantic City International Airport, NJ 08405.APPENDIX O. WAYS TO EVALUATE ICING EXPOSURES RELATIVE TO APPENDIX C
O1. “Icing Design Envelopes (14 CFR-25, 29, Appendix C) Converted to a Distance-Based Format,” Richard K. Jeck, FAA Technical Report DOT/FAA/AR-00/30 (2000), FAA William J. Hughes Technical Center, Atlantic City International Airport, NJ 08405.
APPENDIX P. USING ICING RATE TO DOCUMENT ICING EXPOSURES
P1. “A Workable, Aircraft-Specific Icing Severity Scheme,” R. Jeck, reprint No. AIAA-98-0094, 36th Aerospace Sciences Meeting (1998), American Institute of Aeronautics and Astronautics, Reston, Va. 20191-4344. P2. “A History and Interpretation of Aircraft Icing Intensity Definitions and FAA Rules for Operating in Icing Conditions,” Richard K. Jeck, FAA Technical Report DOT/FAA/AR-01/91 (2001), FAA William J. Hughes Technical Center, Atlantic City International Airport, N.J. 08405. P4. “Icing Design Envelopes (14 CFR-25, 29, Appendix C) Converted to a Distance-Based Format,” Richard K. Jeck, FAA Technical Report DOT/FAA/AR-00/30 (2000), FAA William J. Hughes Technical Center, Atlantic City International Airport, N.J. 08405.
In the later AR-07/04 1, Dr. Jeck describes two key concepts of his analysis:
the HE (horizontal extent) format (later noted as "in-cloud averaging distance" 3),
and "natural occurring probabilities":
This report shows how to convert the conventional liquid water content (LWC) vs mean effective diameter (MED) design envelopes in Appendix C of 14 CFR Part 25 and 14 CFR Part 29 to equivalent, but more useful envelopes based on a LWC vs horizontal extent (HE) format. A number of potential uses are illustrated for the new format, particularly for comparing icing test exposures to the Appendix C envelopes and to natural probabilities of occurrence.
The LWC vs HE envelopes can also be recast into envelopes for any other LWC-related variable, such as icing rate or water catch rate, total water catch, and icing intensity, for example. In addition to the Appendix C design envelopes and their derivatives, envelopes are also presented which depict naturally occurring probabilities (99.9%, 99%, 95%, 90%, and 50%) of LWC and the dependence of these probabilities on median volume diameter (MVD), temperature, altitude, and even on the season of the year.
These can all serve for comparing icing test exposures from natural icing flights, icing wind tunnels, airborne spray tankers, and computer simulations to the design envelopes of Appendix C and to real world statistics for naturally occurring icing conditions.
The methods illustrated here provide the icing practitioner with straightforward, understandable, and meaningful ways to document, compare, and evaluate data on icing conditions. They offer a set of working standards for achieving consistency and uniformity among users. Some methods may be more useful than others, depending on the application, but a variety are offered, with examples, to illustrate the possibilities.
The examples also illustrate the use of computerized spreadsheet software for graphing icing variables and for conveniently adjusting or converting the Appendix C envelopes to fit particular applications. This adds new, modern versatility to the envelopes that is not possible with the conventional printed (fixed) version.
An example of the calculated natural probabilities are the lines on Figure 22, shown at the top of this post.
He acknowledged support for "this long project" (27+ years at that time):
ACKNOWLEDGEMENTS
The author is greatly indebted to colleague Dr. James T. Riley who helped process much of the modern data. Thanks are also due to Ernest Schlatter, former Program Manager for aircraft icing, and to Charles Masters, former Branch Manager for flight safety research, for their patience and support on this long project.
Conclusions
I think that spending decades assembling the Database and then the ground-breaking, detailed analysis (27+ years) qualify as "unwavering devotion ... in the precision of science" noted in Dr. Jeck's obituary 13.
Related
This is part of the series 28,000 Miles of Data: The Publications of Dr. Richard Jeck.
Natural Probabilities are discussed further in the post Natural Probabilities.
Notes
-
Richard K. Jeck: Advances in the Characterization of Supercooled Clouds for Aircraft Icing Applications. DOT/FAA/AR-07/4, Appendix C, November 2008. web.archive.org Note that there is a different pdf file at ntrl.nist, but that copy has blanks for some figures. ↩↩↩
-
Richard Jeck: "A new characterization of the icing environment below 10,000 feet AGL from 7,000 miles of measurements in supercooled clouds". 1985 ntrs.nasa.gov ↩↩
-
Richard Jeck: "Icing Characteristics of Low Altitude, Supercooled Layer Clouds." 1980 FAA/RD-80/24 archive.org [ntrl.ntis.gov has a listing, but does not have a pdf file]. ↩↩
-
Jeck, R.: "A new database of supercooled cloud variables for altitudes up to 10,000 feet AGL and the implications for low altitude aircraft icing. US Department of Transportation Rep." Transportation Rep. DOT/FAA/CT-83/21 137 (1983). ntrs.nasa.gov ↩
-
NB Guttman, RK Jeck, MR Henderson, MD Mueller: The Aircraft Icing Environment in Wintertime, Low Ceiling Conditions. No. NRLMR5650. 1985. (a similar title is at journals.ametsoc.org) ↩
-
Guttman, Nathaniel B., and Richard K. Jeck. "Aircraft icing environment in low ceiling conditions near Washington, DC." Weather and Forecasting 2.2 (1987): 114-126. doi.org ↩
-
C. Masters: "A New Characterization of Supercooled Clouds Below 10,000 Feet AGL" DOT/FAA/CT-83/22 1988
rosap.ntl.bts.gov
The Preface notes: "The preponderance of this work has been performed by Or. Richard K. Jeck of the U.S. Naval Research Laboratory (NRL). The author, in the creation of the new criteria, has used these data extensively, and has received invaluable assistance from Dr. Jeck in the process."
This is why I included it in Dr. Jeck's works. ↩ -
Richard Jeck: "Selecting representative test points for icing conditions using the new faa/nrl database" AIAA-89-719 1989 doi.org ↩
-
Richard Jeck: "Other ways to characterize the icing atmosphere" January 1994 AIAA-94-482 doi.org ↩
-
Jeck, Richard K., Icing Design Envelopes (14 CFR Parts 25 and 29, Appendix C) Converted to a Distance-Based Format, DOT/FAA/AR-00/30, April 2002. ntrl.ntis.gov ↩
-
Jeck, R. K.: Distance-Scaled Water Concentrations versus Mass-Median Drop Size, Temperature, and Altitude in Supercooled Clouds. J. Atmos. Sci., 65, 2087–2106, 2008, journals.ametsoc.org ↩
-
FAA Advisory Circular AC No. 20-73A: Aircraft Ice Protection. August 16, 2006. faa.gov ↩
-
Obituary loudounfuneralchapel.com ↩