"A number of potential uses are illustrated for the new format, particularly for comparing icing test exposures to ... natural probabilities of occurrence."
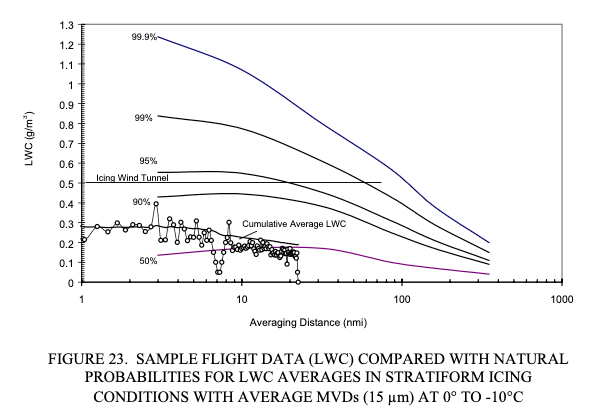
Public Domain image from DOT/FAA/AR-00/30. 1
Introduction
In DOT/FAA/AR-00/30 1 Dr. Jeck wrote of Figure 23:
3.2 COMPARING WITH NATURAL LWC PROBABILITIES.
...
Figure 23 shows a set of LWC probability curves derived from about 23,000 nmi of flight data in stratiform icing conditions. Any given curve indicates the probability that randomly encountered, stratiform icing conditions will have an average LWC somewhere below the curve. For example, the 50% curve means that half of the LWC averages will lie below the curve and half will lie above it. The 90% curve means that 90% of all LWC averages can be expected to lie below it, for any given averaging distance, or horizontal extent.The sample LWC trace has been plotted on this graph to determine where it lies in the realm of probabilities. It is already known from earlier comparisons to the Appendix C envelopes that the sample encounter contained LWCs considerably below the maximum that could be expected. Figure 23 shows exactly how far below the maximum that is. The encounter seems quite acceptable since the cumulative average LWC is greater than the 50% value the entire time. It starts out at perhaps the 70% level and gradually drifts down toward an average (50%) encounter as the flight proceeds.
Here, we will develop means to calculate probabilities for conditions in layer clouds.
The Weibull distribution
Dr. Jeck in DOT/FAA/AR-07/04 2 and "Distance-Scaled Water Concentrations versus Mass-Median Drop Size, Temperature, and Altitude in Supercooled Clouds" 3 describes how the Weibull distribution 4 was used to fit the distance-averaged LWC data to averaging distance. This determined the probability lines on figures such as Figure 23 above.
The Weibull distribution can also be used to interpolate within the figure. The values at the distance lines of Figure 23 were digitized. This allows determining the LWC values at the probability values at a given distance. The Weibull distribution is fit with those local values. Thus, the probability of an arbitrary LWC at that distance can be found, or an LWC values at an arbitrary probability. Extrapolation to higher probabilities is a common use of the Weibull distribution, to estimate values for higher probabilities than the range of data.
The Python programming language with the scypi.stats.weibull_min function was used for the Weibull fits.
This allows automating the Weibull fit process at a given distance.
An illustration of the method
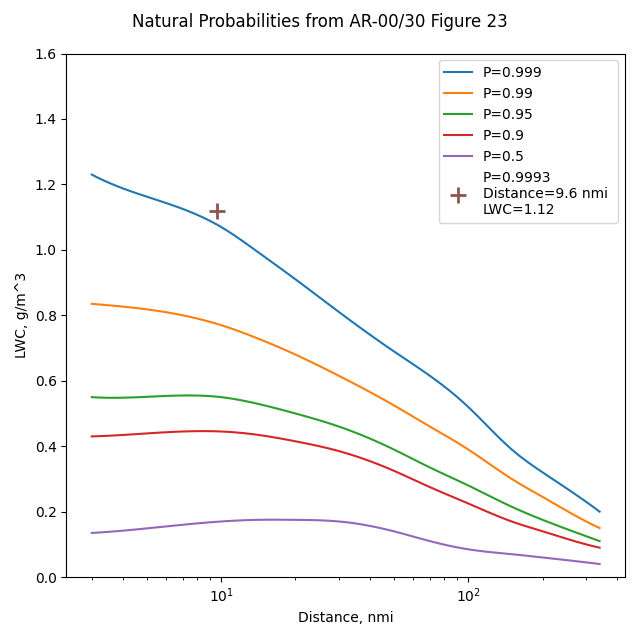
I selected a test point from the layer cloud portion of the Database, Original row 1611, Project NorthSea: 1984. This has a distance of 9.6 nmi, and an LWC value of 1.12. We will calculate the probability.
LWC values for the 9.6 nmi distance are interpolated from the probability curves, and a Weibull fit calculated. The probability of the selected point is then readily calculated.
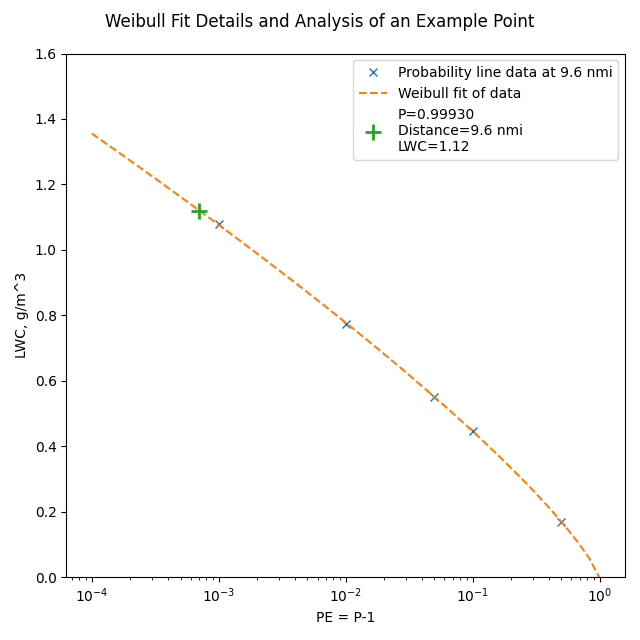
The selected point can be illustrated with the probability lines:
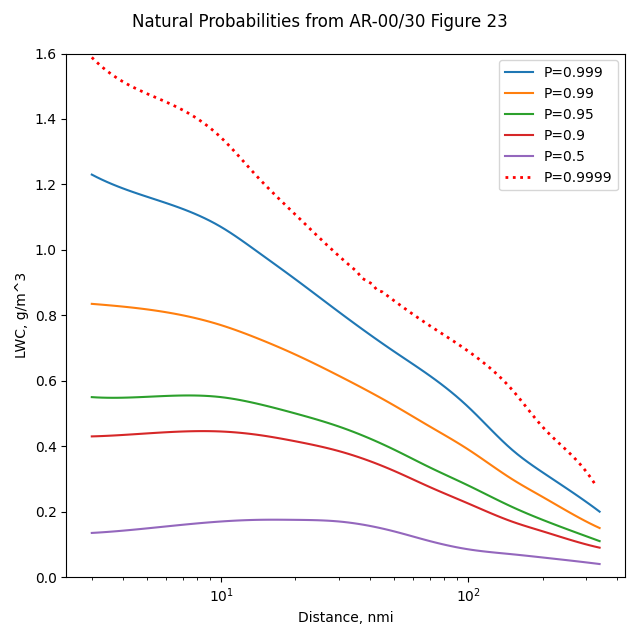
LWC values for a given probability are also readily calculated.
Here, we will add a P=99.99% calculated line:
Related
This is part of the series 28,000 Miles of Data: The Publications of Dr. Richard Jeck.
The program to calculate the Weibull fits is at calc_dist_lwc_probability.py
Notes
-
Jeck, Richard K., Icing Design Envelopes (14 CFR Parts 25 and 29, Appendix C) Converted to a Distance-Based Format, DOT/FAA/AR-00/30, April 2002. ntrl.ntis.gov ↩↩
-
Richard K. Jeck: Advances in the Characterization of Supercooled Clouds for Aircraft Icing Applications. DOT/FAA/AR-07/4, Appendix C, November 2008. web.archive.org Note that there is a different pdf file at ntrl.nist, but that copy has blanks for some figures. ↩
-
Jeck, R. K.: Distance-Scaled Water Concentrations versus Mass-Median Drop Size, Temperature, and Altitude in Supercooled Clouds. J. Atmos. Sci., 65, 2087–2106, 2008, journals.ametsoc.org ↩
-
The Weibull Distribution en.wikipedia.org ↩