"the collection of data indicating the maximum extent, severity, and frequency of conditions"
"Meteorological Analysis of Icing Conditions Encountered in Low-Altitude Stratiform Clouds"
Summary
Data about the horizontal and vertical extend of icing clouds.
Key Points
- A factor of distance traveled in icing related to liquid water content is noted.
- The maximum vertical extent of icing clouds is quantified.
- "Observations ... during the 1948-49 and 1949-50 winters were in substantial agreement with values previously reported."
Abstract
Liquid-water content, droplet size, and temperature data measured during 22 flights in predominantly stratiform clouds through the 1948-49 and the 1949-50 winters are presented. Several icing encounters were of greater severity than those previously measured over the same geographical area, but were within the limits of similar measurements obtained over different terrain within the United States. An analysis of meteorological conditions existing during the 74 flights conducted for four winters indicated an inverse relation of liquid-water concentration to maximum horizontal extent of icing clouds. Data on the vertical extent of supercooled clouds are also presented. Icing conditions were most likely to occur in the southwest and northwest quadrants of a cyclone area, and least likely to occur in the southeast and northeast quadrants where convergent air flow and lifting over the associated warm frontal surface usually cause precipitation. Additional data indicated that, icing conditions were usually encountered in nonprecipitating clouds existing at subfreezing temperatures and were unlikely over areas where most weather observing stations reported the existence of precipitation. Measurements of liquid-water content obtained during 12 flights near the time and location of radiosonde observations were compared with theoretical values. The average liquid-water content of a cloud layer, as measured by the multicylinder technique, seldom exceeded two-thirds of that which could be released by adiabatic lifting. Local areas near the cloud tops equaled or occasionally exceeded the calculated maximum quantity of liquid water.
Discussion
INTRODUCTION
One phase of the icing research program conducted at the NACA Lewis laboratory consisted of supplementing laboratory icing studies with research flights in supercooled clouds. The meteorological aspects of icing research included (1) development and testing of instruments for measuring icing conditions during flight, (2) collection of data indicating the maximum extent, severity, and frequency of conditions for which thermal anti-icing systems should be expected to provide protection, and (3) application of flight experience and meteorological data to the development of forecasting techniques usable in flight planning and navigation to avoid potentially hazardous conditions.
Sufficient in-flight measurements of icing conditions have been made by the NACA and other organizations to provide tentative design criterions for thermal anti-icing systems (reference 1). The meteorological data accumulated by the Lewis laboratory during the 1946-47 and the 1947-48 winter seasons are presented in references 2 and 3, respectively. Additional data are desirable to assure the adequacy and statistical reliability of previous information, and, if necessary, to revise or to extend proposed design conditions. The observations made during the 1948-49 and the 1949-50 winters are presented herein. In addition, data gathered during four winters of icing research flights are presented that indicate the vertical and horizontal extent of supercooled. stratiform clouds encountered and their location in relation to existing synoptic weather conditions.
Reference 1 is NACA-TN-1855.
APPARATUS AND METHOD
The airplanes used for research flights In icing conditions were bomber-type aircraft equipped with thermal anti-icing systems. Icing instruments Installed on the airplanes for the 1948-49 winter were similar to those described in reference 3. The following Instruments, designed to provide Improved and more complete measurements of meteorological data, were used. during the 1949-50 winter:
Rotating multicylinders consisting of five cylinders each 2 inches in length with diameters of 1/8, 1/2, 1, 3, and 4 inches with integral flanges and transition segments designed to reduce end effects and to provide two-dimensional flow around the cylinders
Impingement recorder consisting of a 6-inch-diameter cylinder around which a movable water-sensitive tape was exposed for 2 to 6 seconds; the maximum-effective droplet diameter was calculated from the observed extent of impingement
Cloud detector consisting of an electrically heated metallic probe for indicating presence of liquid water by measuring and recording temperature fluctuations caused by evaporation of impinging water
Three rotating-disk icing-rate meters installed for comparison and developmental tests
Shielded thermocouples for continuous recording of free-air temperature
The continuously recording icing-rate meters were calibrated against the multicylinders and provided data concerning short duration or nearly instantaneous liquid-water concentrations encountered in supercooled. cloud formations. Maximum values obtained with the icing-rate meter are used. In this report to supplement the measurements of icing intensity obtained over greater horizontal distances with the multicylinders.
Reference 3 is NACA-TN-1793.
Results and Discussion
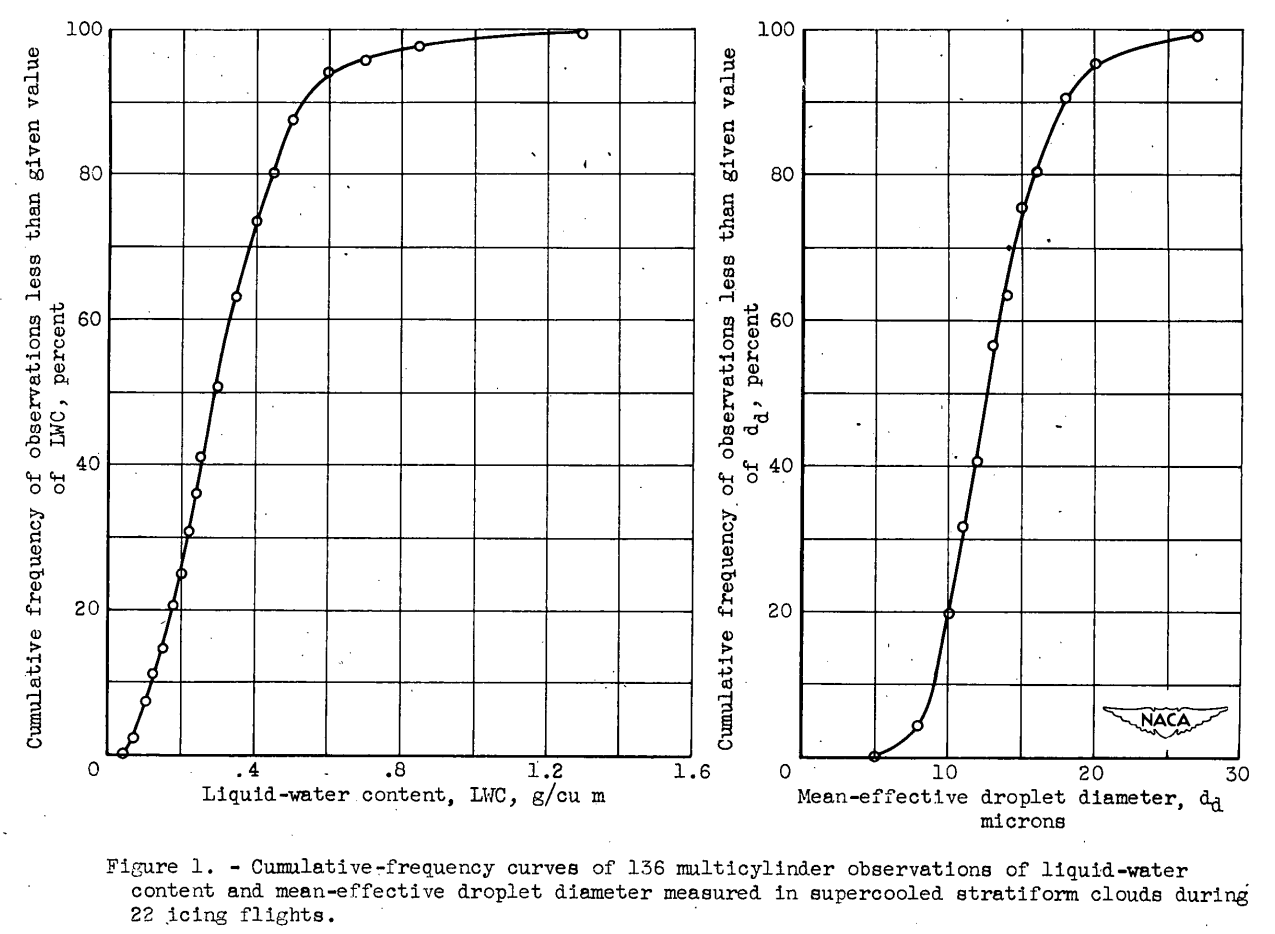
Cumulative-frequency curves of the 136 observations of liquid-water content and mean-effective droplet diameter measured in 22 flights conducted during the 1948-49 and the 1949-50 winters are presented in figure 1. The liquid-water content data indicate that 50 percent of the multicylinder observations were in clouds with water concentrations in excess of 0.30 gram per cubic meter, whereas 10 percent of the observations indicated values higher than 0.54 grain per cubic meter. The extreme value of 1.30 grams per cubic meter (flight 11) was measured over a 5-minute exposure period of the multicylinders during straight-line flight.
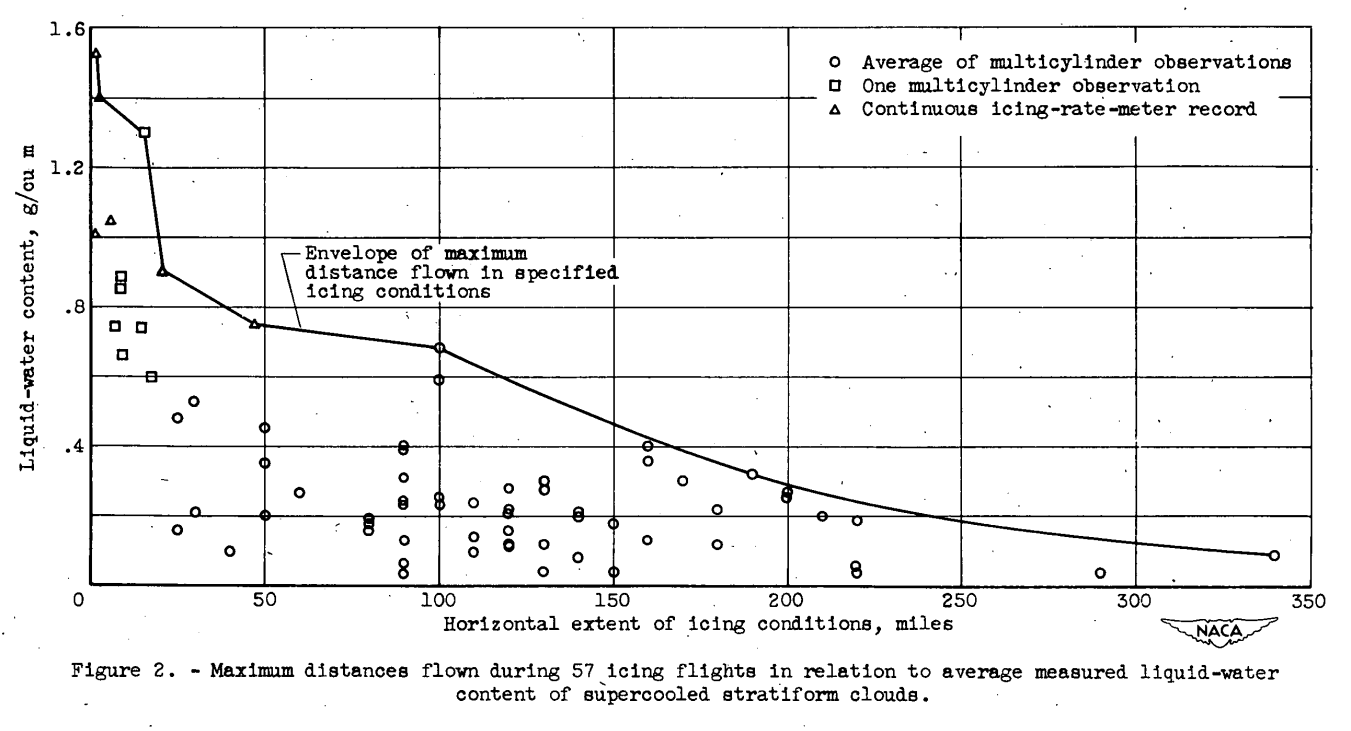
Of 74 flights conducted during the four winters for which in- flight data are available, 57 flights encountered a trace or more of ice. Multicylinder measurements of liquid-water concentrations obtained during each of the flights were averaged and plotted against the maximum distance flown in any one direction in icing, as shown in figure 2. In order to provide additional data in the higher ranges of liquid-water content, the distance traversed on a single heading during one multicylinder exposure was used as the extent of measured liquid-water concentrations in excess of 0.50 gram per cubic meter. Such data are only approximate because the icing severity during the interval between consecutive multicylinder observations was indeterminant except during flights when icing-rate-meter data were available. Extreme values of liquid-water content, obtainable from continuous icing-rate-meter records, were used to provide additional information on the extent of instantaneous or short-duration liquid-water concentrations. In most instances, the data in figure 2 approximate the maximum geographical extent of the continuous icing clouds. Comparison of these data with those measured over the western sections of the United States reported in reference 4 indicates substantial agreement throughout the range of maximum values encountered irrespective of the diverse geographical areas and predominantly different cloud types explored.
Inspection of figure 2 indicates that liquid-water concentrations as high as 1.30 grams per cubic meter existed over a horizontal distance of 15 miles, 0.70 gram per cubic meter for a distance of approximately 100 miles, and a maximum average concentration of 0.30 gram per cubic meter over a distance of nearly 200 miles.
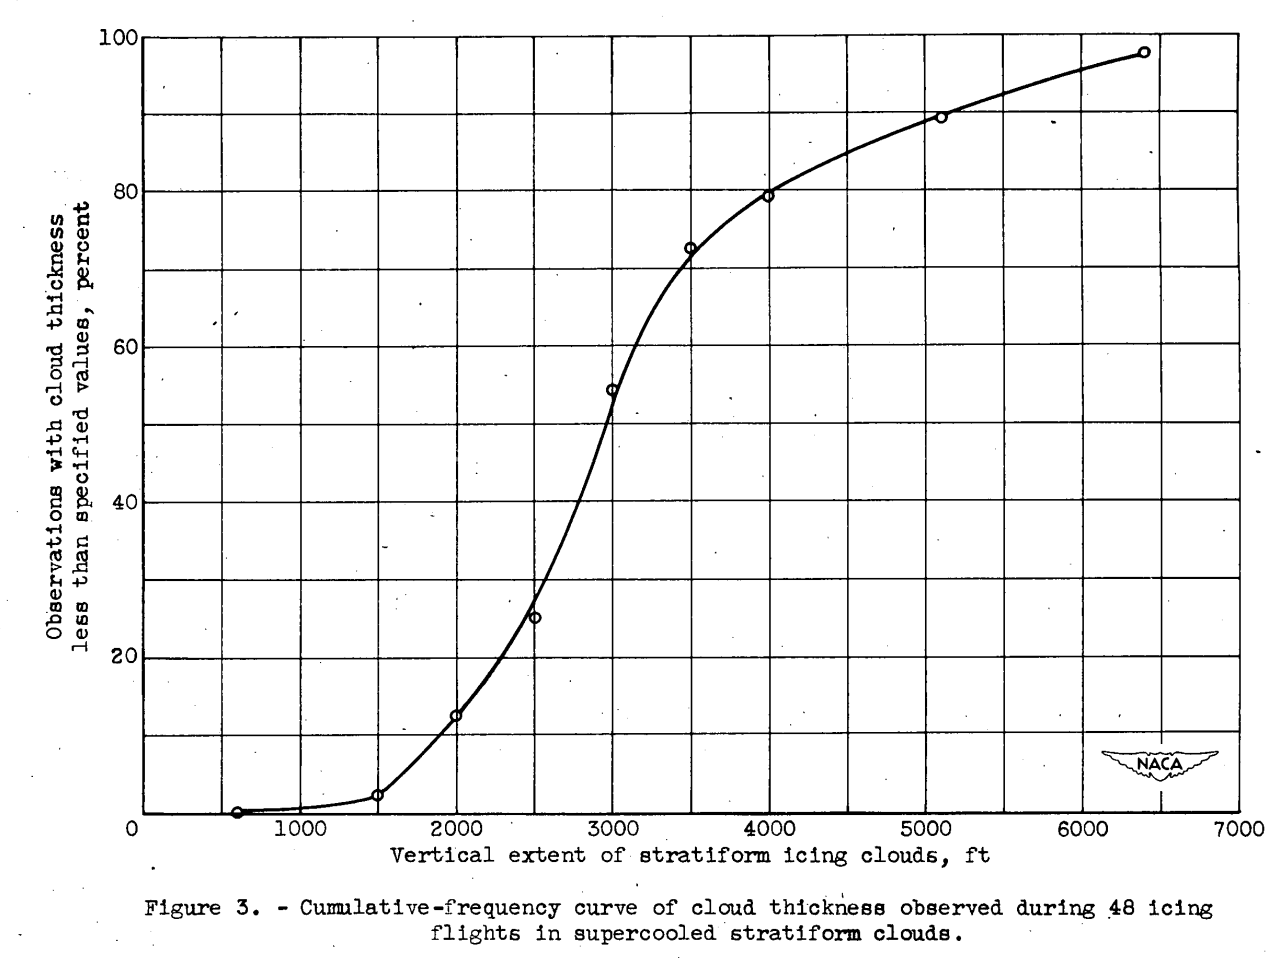
Vertical extent of stratiform icing clouds. -
The depth of continuous icing clouds is a factor to be considered in flight navigation to reduce the rate of ice accretion, particularly with unprotected aircraft. In order to provide information on the average and the maximum vertical extent of continuous or nearly continuous icing conditions, data were obtained when feasible either by surveying the clouds or by noting the height of the cloud tops in relation to the height of the cloud bases reported by weather observing stations over the flight area. Reliable data were obtained for a total of 48 flights during four winters of icing flights. The observations were generally obtained over terrain where orographic effects were considered negligible. The maximum depth of the icing clouds was not determined as the thickness of one particular icing cloud layer in every case. Two or more cloud layers sufficiently close together, or with varying bases and tops such that icing conditions were unavoidable without frequent changes in flight altitude, were considered as one cloud layer. The maximum vertical extent of multiple cloud layers was approximately 6500 feet as indicated in figure 3. Eighty percent of the icing conditions was less than 4000 feet in vertical extent. The average observed vertical extent of stratiform icing clouds was approximately 3000 feet. Flight surveys indicated a maximum depth of 3500 feet. for any single cloud layer, which is in approximate agreement with the discussion of cloud-thickness values presented in reference 2.
Reference 2 is NACA-TN-1424
Conclusions
SUMMARY OF RESULTS
The following results were obtained from data taken during 74 flights in search of icing conditions over the northern regions of the United States east of the Rocky Mountain area with measurements in the Great Lakes area predominating:
Observations of liquid-water concentrations and mean-effective droplet sizes obtained during flight in stratiform clouds at altitudes below 10,000 feet during the 1948-49 and 1949-50 winters were in substantial agreement with values previously reported. Some slight differences existed, which were attributed to measuring techniques and emphasis upon obtaining data in more severe conditions.
Comparison of average liquid-water contents with horizontal extent of the icing clouds indicated that values up to approximately 1.30 grams per cubic meter existed over a distance of 15 miles, 0.70 gram per cubic meter for a distance of 100 miles, and a maximum average liquid-water content of 0.30 gram per cubic meter over a distance of approximately 200 miles.
The maximum vertical depth of multiple layer supercooled stratiform clouds observed in flight predominantly over level terrain was approximately 6500 feet, whereas 80 percent of the icing conditions was less than 4000 feet in vertical extent. The average thickness of supercooled cloud layers so far observed is about 3000 feet. The maximum observed thickness of any one cloud layer was 3500 feet and is in approximate agreement with observations over other geographical areas of the United States.
In stratiform clouds existing at subfreezing temperatures below 10,000 feet, icing conditions could be expected if no precipitation were reported by ground observing stations over the cloud area. Conversely, continuous icing rarely occurred when most observing stations over the area were reporting measurable precipitation (except in the case of freezing rain).
In low-level clouds, the most probable icing area associated with an extratropical cyclonic disturbance was located in the northwest and the southwest quadrants of the low-pressure area. Icing conditions occasionally existed in clouds below 10,000 feet near the periphery of precipitation areas.
The average liquid-water content as measured by multicylinders did not exceed two-thirds of the theoretical maximum values.
Maximum values of icing severity measured with the rotating-disk icing-rate meter indicated that localized regions might accumulate liquid-water concentrations equal to or in excess of the adiabatic amounts.
We saw the rotating-disk instrument in NACA-RM-A9C09 Instruments
Citations
An online search (scholar.google.com) found 19 citations for NACA-TN-2306.
NACA-TN-2306 focussed part of its study on icing in stratiform clouds at altitudes below 10,000 feet. For more recent data on icing conditions below 10,000 feet, see Jeck 2 and Masters 3. Jeck cites NACA-TN-2306. Masters does not cite NACA-TN-2306, but does cite Jeck. Figure 6 from Masters compares the data to Appendix C:
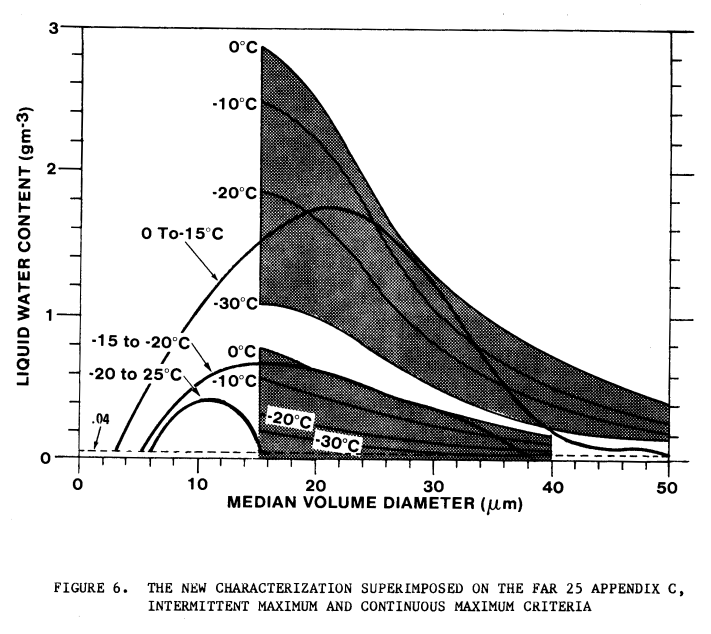
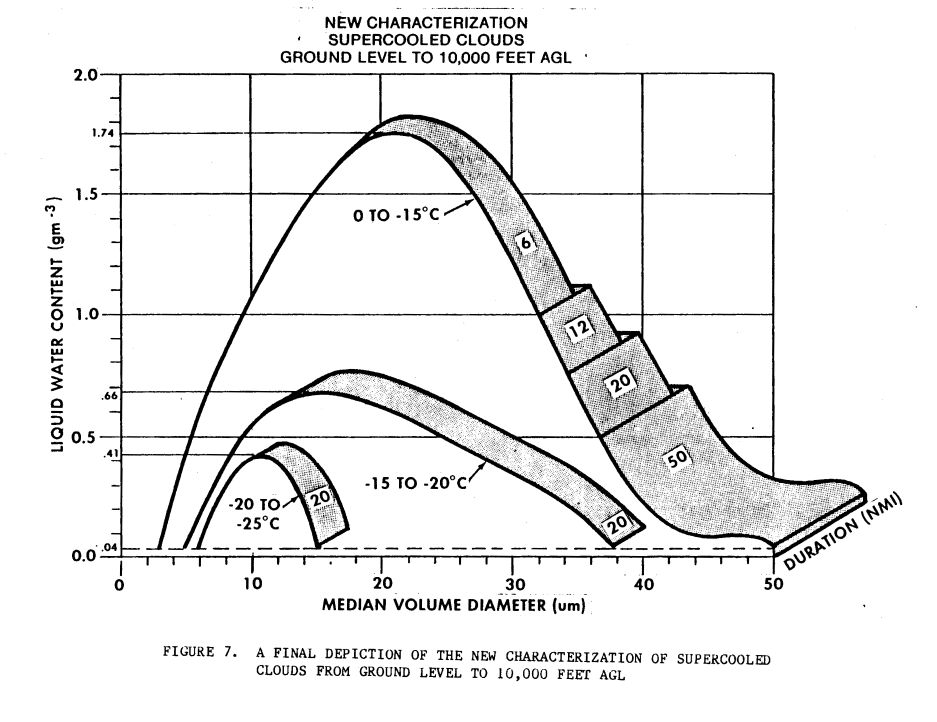
Figure 7 from Masters plots a duration (nmi) effect on LWC. However, the unconventional plot obscures the peak LWC values for durations other than 6 nmi (the end points are visible), so it is difficult to compare to NACA-TN-2306 Figure 2 above.
Notes
-
Kline, Dwight B., and Walker, Joseph A.: Meteorological Analysis of Icing Conditions Encountered in Low-Altitude Stratiform Clouds. NACA-TN-2306, 1951. ntrs.nasa.gov ↩
-
Jeck, Richard K: "A new database of supercooled cloud variables for altitudes up to 10,000 feet AGL and the implications for low altitude aircraft icing", DOT/FAA/CT-83/21, 1983. tc.faa.gov ↩
-
Masters, Charles O.: A new characterization of supercooled clouds below 10,000 feet AGL. US Dept. of Transportation Report DOT. FAA/CT-83/22, 1983. tc.faa.gov ↩