"Statistical values that represent the meteorological and climatic variations, which are associated with icing, will indicate what to expect in normal flight operations." 6
From NACA-TN-4314.
Summary
Several publications by Porter Perkins were included in The Historical Selected Bibliography of NACA-NASA Icing Publications in the "Meteorology of Icing Clouds" section.
Discussion
The first several publications are only briefly described, as their major results are incorporated into the final publication, NASA Memo 1-19-59E, which will be reviewed at length.
Note that NACA-RM-E52J06 outlines the need for data from broader sources, that is a theme in these publications:
The majority of the research flights into icing conditions were made by attempting to select weather conditions, flight paths, and altitudes, which would yield heavy or continuous icing. Multiple traverses were often made when such conditions were found. It is impossible, therefore, to determine from this information the extent or frequency of specified icing conditions that would be encountered during normal flight operations such as those experienced by airlines on routine schedules.
NACA-RM-E51D18, "Analysis of Meteorological Data Obtained During Flight in a Supercooled Stratiform Clouds of High Liquid-Water Content", 1951 1
This describes the use of the rotating-disk-type icing-rate meter.
SUMMARY
Flight icing-rate data obtained in a dense and abnormally deep supercooled stratiform cloud system indicated the existence of liquid-water contents generally exceeding values in amount and extent previously reported over the midwestern sections of the United States. Additional information obtained during descent through a part of the cloud system indicated liquid-water contents that significantly exceeded theoretical values, especially near the middle of the cloud layer. The growth of cloud droplets to sizes that resulted in sedimentation from the upper portions of the cloud is considered to be a possible cause of the high water contents near the center of the cloud layer. Flight measurements of the vertical temperature distribution in the cloud layer indicated a rate of change of temperature with altitude exceeding that of the moist adiabatic lapse rate. This excessive rate of change is considered to have contributed to the severity of the condition.
APPARATUS AND PROCEDURE
The meteorological instrumentation on the research aircraft permitted continuous measurements of liquid-water content during flight and, in addition, made available data concerning the vertical variation of liquid-water content through a dense region of the stratiform cloud layer.
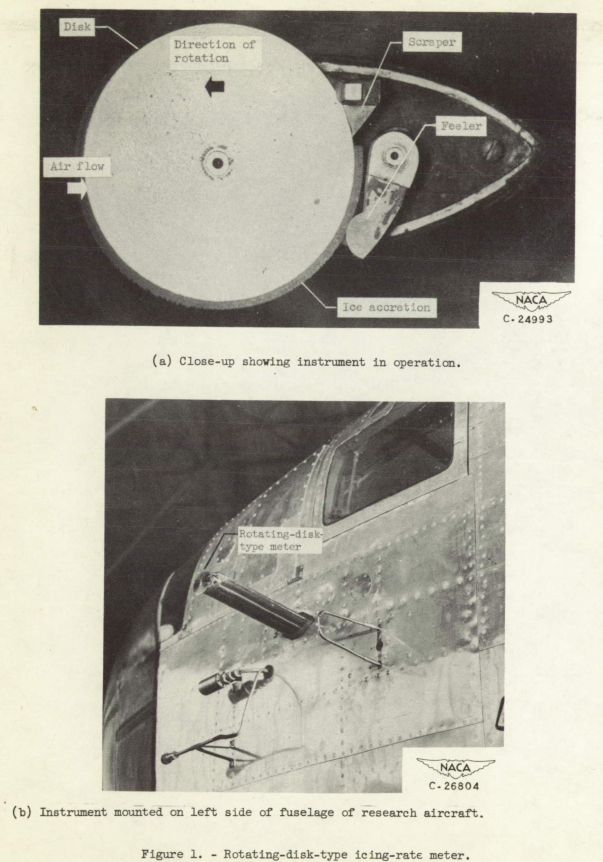
These data were obtained with a rotating-disk-type icing-rate meter calibrated to measure liquid-water content of icing clouds. This instrument was first developed by the Massachusetts Institute of Technology (reference 1) and consisted essentially of a rotating disk edge-wise to the air stream, a feeler for measuring the thickness of ice collected on the edge, and a scraper for removing the ice after it had been measured. A photograph of the instrument in operation is given in figure 1(a). The complete instrument is shown in figure 1(b) mounted on the left side of the fuselage of the research aircraft used in this investigation.
NACA-RM-E52J06, "Preliminary Survey of Icing Conditions Measured During Routine Transcontinental Airline Operation", 1952 2
The data from this are included in the later NASA Memo 1-19-59E.
SUMMARY
Icing data collected on routine operations by four DC-4-type aircraft equipped with NACA pressure-type icing-rate meters are presented as preliminary information obtained from a statistical icing data program sponsored by the NACA with the cooperation of many airline companies and the United States Air Force. The program is continuing on a much greater scale to provide large quantities of data from many air routes in the United States and overseas. Areas not covered by established air routes are also being included in the survey.
The four aircraft which collected the data presented in this report were operated by United Air Lines over a transcontinental route from January through May, 1951. An analysis of the pressure-type icing-rate meter was satisfactory for collecting statistical data during routine operations. Data obtained on routine flight icing encounters from these four instrumented aircraft, although insufficient for a conclusive statistical analysis, provide a greater quantity and considerably more realistic information than that obtained from random research flights. A summary of statistical data will be published when the information obtained daring the 1951-52 icing season and that to be obtained during the 1952-53 season can be analyzed and assembled. The 1951-52 data already analyzed indicate that the quantity, quality, and range of icing information being provided by this expanded program should afford a sound basis for ice-protection-system design by defining the important meteorological parameters of the icing cloud.
INTRODUCTION
The meteorological phase of the icing research program conducted by the NACA has been previously confined to research flights into icing conditions. These in-flight measurements of the meteorological quantities associated with aircraft icing (summarized in reference 1) have been limited to a relatively small number of flights over confined sections of the country and have thus provided only tentative design criteria for ice-protection systems.
The majority of the research flights into icing conditions were made by attempting to select weather conditions, flight paths, and altitudes, which would yield heavy or continuous icing. Multiple traverses were often made when such conditions were found. It is impossible, therefore, to determine from this information the extent or frequency of specified icing conditions that would be encountered during normal flight operations such as those experienced by airlines on routine schedules. Additional data are needed to substantiate or to modify the ice-protection-system design conditions in order that all-weather protective designs can be accomplished with the lowest possible penalties in terms of performance and payload. Statistical icing data obtained from routine operations could serve both as a basis for optimum design of ice-protection systems and as an aid to the operator in prescribing flight-control procedures, such as preferred altitudes, which would avoid or minimize hazardous icing conditions.
With the realization of this need for additional information, the NACA Lewis laboratory has initiated a program in cooperation with the major airlines and the United States Air Force to obtain measured icing data encountered during routine operations. These data include measurements of icing rate, liquid-water content computed from icing rate and airspeed, temperature, duration of icing, observations of the geographic location, type of ice, and effect of icing on the aircraft
NACA-RM-E55F28a, "Statistical Survey of Icing Data Measured on Scheduled Airline Flights over the United States and Canada from November 1951 to June 1952", 1955 3
The data from this are included in the later NASA Memo 1-19-59E.
SUMMARY
A statistical survey and a preliminary analysis are made of icing data collected from scheduled flights over the United States and Canada from November 1951 to June 1952 by airline aircraft equipped with NACA pressure-type icing-rate meters. This interim report presents information obtained from a continuing program sponsored by the NACA with the cooperation of the airlines.
An analysis of over 600 icing encounters logged by three airlines operating in the United States, one operating in Canada and one operating up the coast to Alaska, is presented. The icing conditions encountered provided relative frequencies of many icing-cloud variables, such as horizontal extent, vertical thickness, temperatures, icing rate, liquid-water content, and total ice accumulation.
Liquid-water contents were higher than data from earlier research flights in layer-type clouds but slightly lower than previous data from cumulus clouds. Broken-cloud conditions, indicated by intermittent icing, accounted for nearly one-half of all the icing encounters. About 90 percent of the encounters did not exceed a distance of 120 miles, and continuous icing did not exceed 50 miles for 90 percent of the unbroken conditions. Icing cloud thicknesses measured during climbs and descents were less than 4500 feet for 90 percent of the vertical cloud traverses.
NACA-TN-3984, "Statistical Study of Aircraft Icing Probabilities at the 700- and 500- Millibar Levels over Ocean Areas in the Northern Hemisphere", 1957 4
The data from this are included in the later NASA Memo 1-19-59E.
SUMMARY
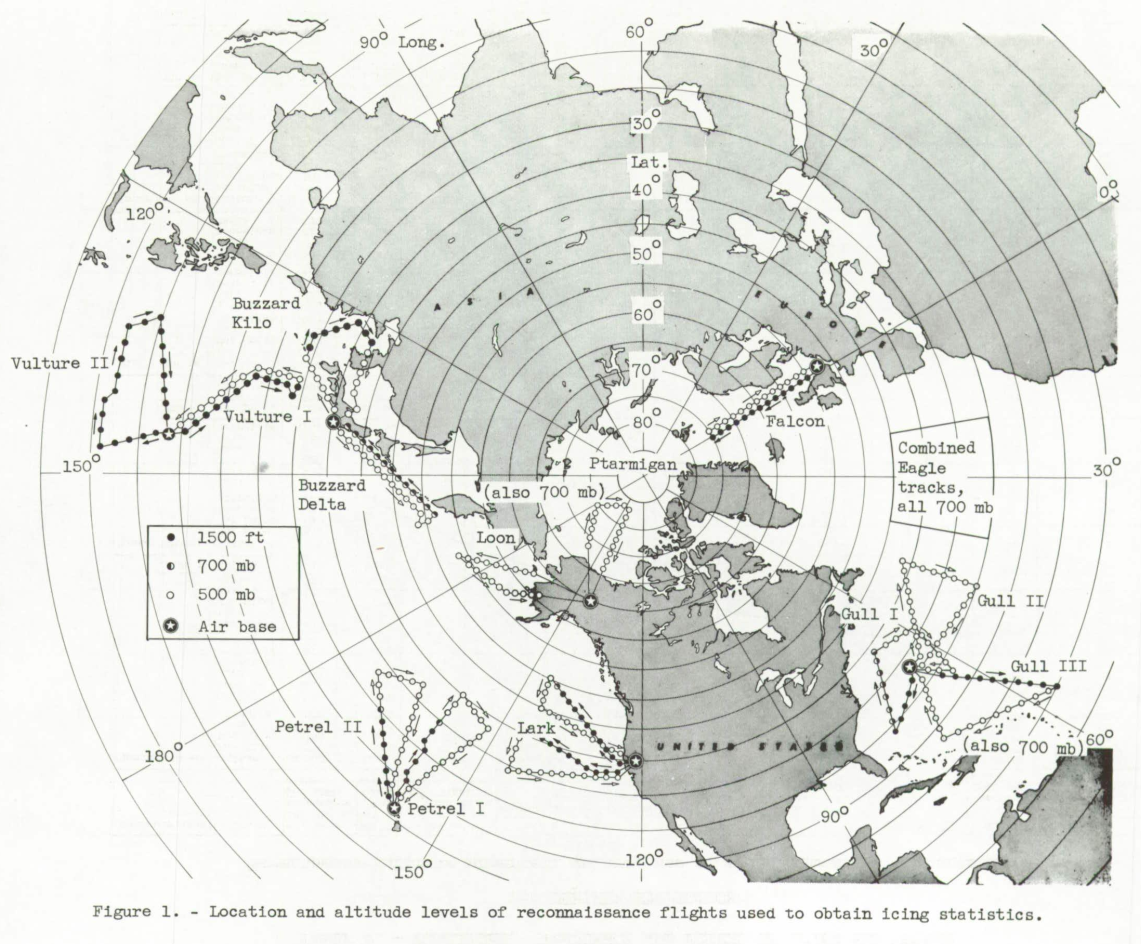
A statistical study is made of icing data reported from weather reconnaissance aircraft flown by Air Weather Service (USAF). The weather missions studied were flown at fixed flight levels of 500 millibars (18,000 ft) and 700 millibars (10,000 ft) over wide areas of the Pacific, Atlantic, and Arctic Oceans. This report is presented as part of a program conducted by the NACA to obtain extensive icing statistics relevant to aircraft design and operation.
The thousands of in-flight observations recorded over a 2- to 4-year period provide reliable statistics on icing encounters for the specific areas, altitudes, and seasons included in the data. The relative frequencies of icing occurrence are presented, together with the estimated icing probabilities and the relation of these probabilities to the frequencies of flight in clouds and cloud temperatures.
The results show that aircraft operators can expect icing probabilities to vary widely throughout the year from near zero in the cold Arctic areas in winter up to 7 percent in areas where greater cloudiness and warmer temperatures prevail. The data also reveal a general tendency of colder cloud temperatures to reduce the probability of icing in equally cloudy conditions.
NACA-TN-4314 "Icing Frequencies Experienced During Climb and Descent by Fighter-Interceptor Aircraft", 1958 5
The data from this are included in the later NASA Memo 1-19-59E.
SUMMARY
Data and analyses are presented on the relative frequencies of occurrence and severity of icing cloud layers encountered by jet aircraft in the climb and descent phases of flights to high altitudes. Fighter-interceptor aircraft operated by the Air Defense Command (USAF) at bases in the Duluth and Seattle areas collected the data with icing meters installed for a 1-year period. The project was part of an extensive program conducted by the NACA to collect Icing cloud data for evaluating the icing problem relevant to routine operations.
The average frequency of occurrence of icing was found to be about 5 percent of the number of climbs and descents during 1 year of operations The icing encounters were predominantly in the low and middle cloud layers, decreasing above 15,000 feet to practically none above 25,000 feet.
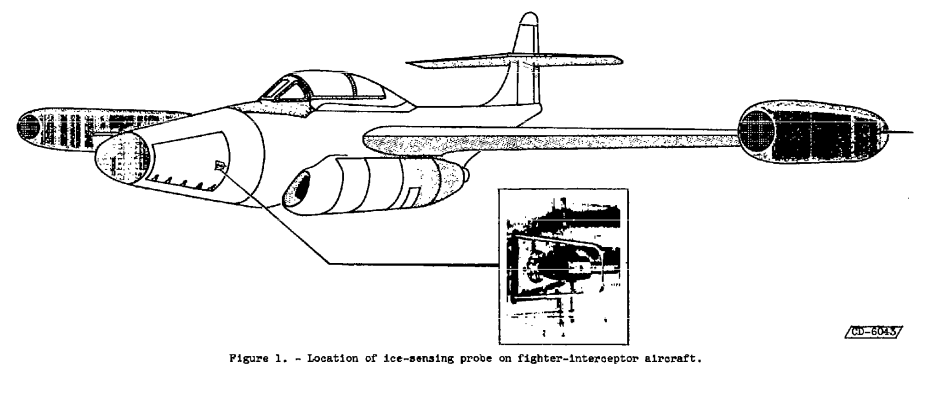
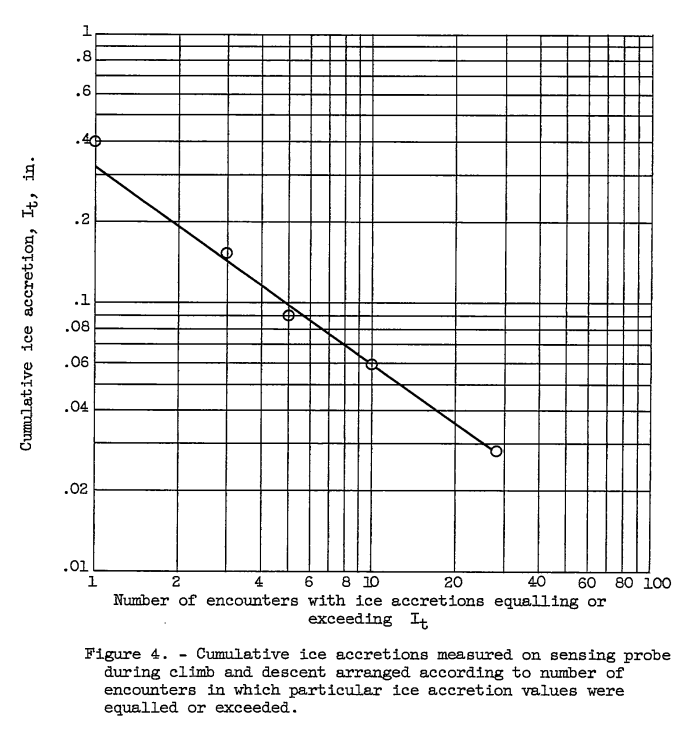
The greatest thickness of ice that would accumulate on any aircraft component (as indicated by the accretion on a small object) was measured with the icing meters. The ice thicknesses on a small sensing probe averaged less than 1/32 inch and did not exceed 1/2 inch. Such accumulations are relatively small when compared with those that can form during horizontal flight in icing clouds. The light accretions resulted from relatively steep angles of flight through generally thin cloud layers.
Because of the limited statistical reliability of the results, an analysis was made using previous statistics on icing clouds below an altitude of 20,000 feet to determine the general icing severity probabilities. The calculations were made using adiabatic lifting as a basis to establish the liquid-water content. Probabilities of over-all ice accretions on a small object as a function of airspeed and rate of climb were computed from the derived water contents. These results were then combined with the probability of occurrence of icing in order to give the icing severity that can be expected for routine aircraft operations.
NASA Memo 1-19-59E "Summary of Statistical Icing Cloud Data Measured Over United States and North Atlantic, Pacific, and Arctic Oceans During Routine Aircraft Operations", 1959 6
SUMMARY
An extensive program was conducted to obtain icing-cloud statistics needed in aircraft design and operation. The data were collected during routine flights of airline end United States Air Force aircraft. Pressure-sensitive icing meters were installed on 72 service aircraft flown by several different cooperating organizations along domestic and overseas airways and over wilde areas of the Pacific and Arctic oceans.
The results of this survey are summarized in tabular form and as frequency distributions of the measured icing-cloud parameters. Distributions are given for cloud liquid-water content, distance traveled in icing, depth of an icing-cloud layer, temperature of icing clouds, and a reference measure of the total ice accretion (thickness) resulting from over-all exposure to the cloud system.
Data were received from 3200 icing-cloud encounters recorded over several icing seasons. Statistical presentation of these data required defining a unit of cloud system length, particularly for conditions of intermittent icing produced by broken clouds. A unit dicing encounter, frequently containing several separate periods of icing, was established when a period of no lce accretion exceeded 10 minutes. The distance traveled within icing clouds, when accumulated for an encounter, exceeded 56 miles in 10 percent of the encounters. The distribution of liquid-water content, averaged over short distances (1-min intervals of flight), showed a mean of 0.25 gram per cubic meter with values under 0.6 gram per cubic meter existing 90 percent of the time. These cloud water contents were about two-thirds of those calculated from adiabatic lifting theory using the measured cloud depths and temperature data. The distribution of icing temperatures showed that clouds colder than -20° C existed in 10 percent of the encounters.
RESULTS AND DISCUSSION
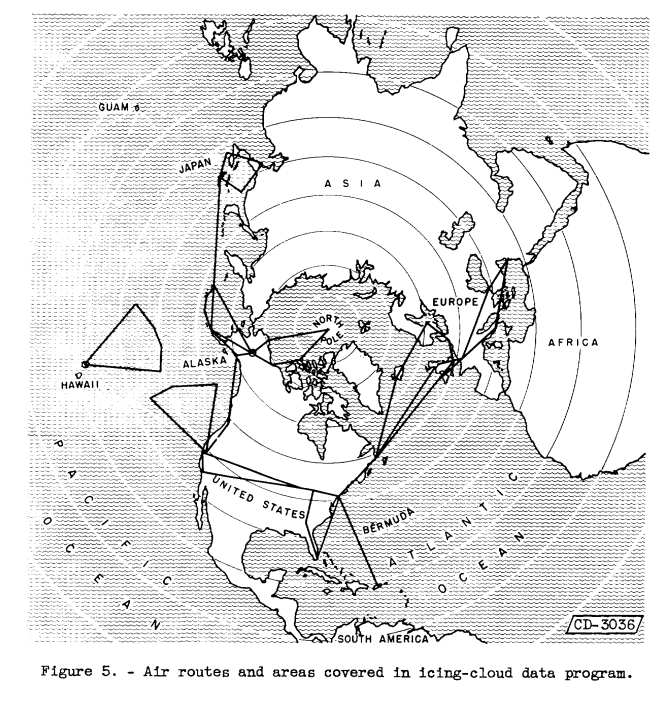
Air Routes and Areas Covered in Survey
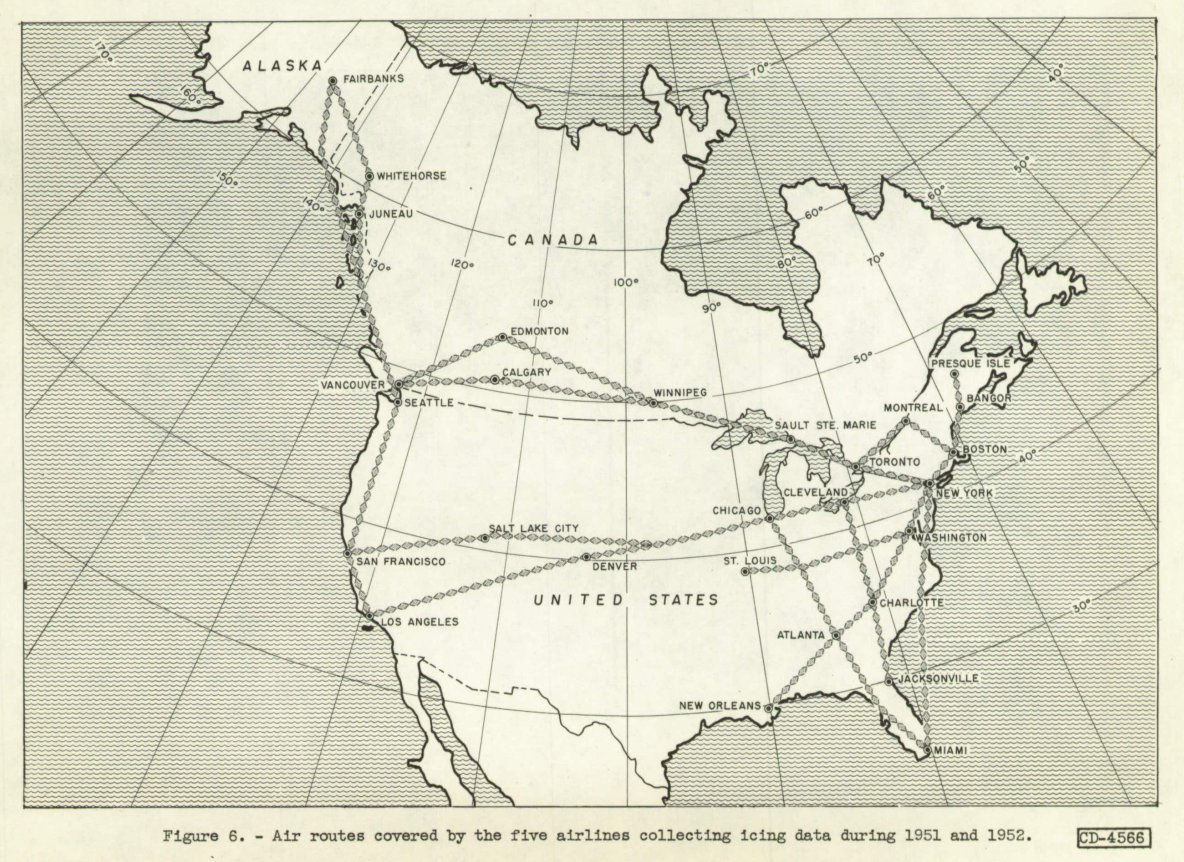
The approximate location of the air routes and areas over which the icing-cloud data were collected are indicated on a northern hemisphere map in figure 5. Data from United States and overseas airways were received mostly from the airline companies that participated. Icing encountered over ocean areas was reported from weather reconnaissance flights made by the U. S. Air Force squadrons operated by the Air Weather Service. These flights were conducted daily along prescribed tracks ranging up to 2400 miles in length. Table I lists the separate alr routes and areas, the corresponding organizations that contributed data, and the types of aircraft that were instrumented. A total of 72 icing-meter installations were proportioned among the various organizations to obtain as complete a coverage as possible.
The distribution of 1-minute average water concentrations is also plotted in cumulative form in figure 7. In this type of graph a particular value of a given variable is plotted against the fraction of the total number of measurements in which this value is exceeded. This fraction represents the frequency in which a specified value is exceeded and can be interpreted as the probability of encountering values greater than that amount. In this manner the probability of the higher water contents can be better estimated. A straight-line relation on a semilog grid was drawn through the data points. The meter readings that fall above the line in the region between 0.4 and 0.7 gram per cubic meter and those that fall below the line beyond 0.7 gram per cubic meter can be interpreted as resulting from the operating characteristics of the sensing probe, as discussed in appendix B. The relation of this probability distribution to a calculated value shown as a dashed line is discussed in a following section. The measured probabilities indicate that water concentrations averaged over 1-minute intervals would be experienced approximately as follows:
(1) 0.3 Gram per cubic meter exceeded in approximately 33 percent of the intervals
(2) 0.6 Gram per cubic meter exceeded in 10 percent of the intervals
(3) 1.1 Grams per cubic meter exceeded in 1 percent of the intervalsThese results are lower than preliminary values published in an interim report (ref. 3). The data presently reported are considered more reliable because they are based on a larger sampling of data, and on improved installation and operation of the icing meter. A comparison of the data from this program with values from multicylinder measurements taken earlier (ref. 1) shows that higher water contents (>0.5 g/cu m) averaged over short distances exist somewhat more frequently then was previously indicated.
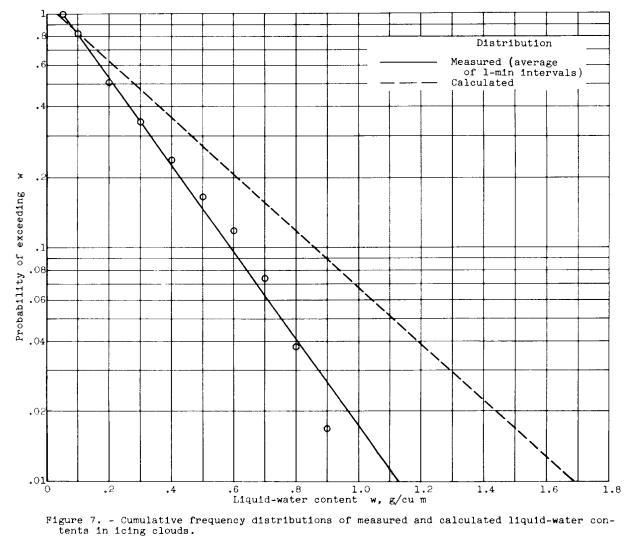
The "calculated" line is based on ideal adiabatic lift theory, briefly described in Appendix D.
"ref. 1" is NACA-TN-2738. "ref. 3" is NACA-RM-E55F28a.
APPENDIX B
CALIBRATION OF ICING METERS
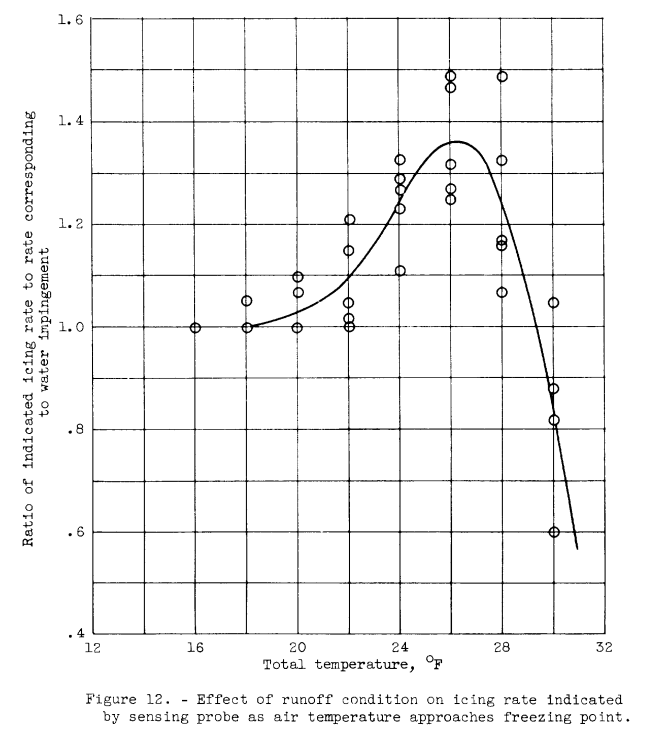
The operation of the icing meter was most seriously effected when a so-called runoff condition occurred. This condition, which affects all ice-collecting instruments, is defined as a surface effect where the impinging water fails to freeze immediately because the surface temperature has been elevated to the freezing point by the latent heat of fusion. The extent to which this occurs depends on the heat balance on the surface, which is a function primarily of the impingement rate, droplet size, air temperature, airspeed, and altitude. If these conditions are such that the surface temperature remains below freezing, the ice continues to build up. When the surface approaches the freezing point, however, less ice will form and the excess water runs along the surface and may freeze back of the leading edge or may blow off. The icing-meter probe is especially sensitive to this condition in that the liquid water on the surface acts to plug the holes with a smaller than normal ice thickness and in an erratic fashion. This situation is illustrated in figure 12 where a given icing rate is maintained while the air temperature is brought up toward the freezing point. The ratio of the indicated icing rate to an icing rate corresponding to the water impingement rate is plotted against air temperature. The indicated rate is a calculated value assuming a constant ice thickness for the indicated icing times.
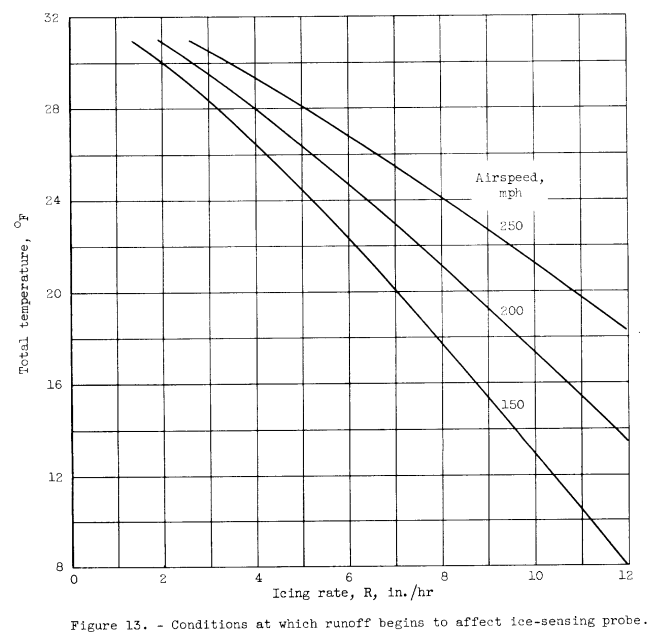
The data points of figure 12 show that during runoff this rate can approach values 50 percent higher than the icing rate prior to runoff. The readings are erratic, which makes any correction factors difficult to determine. As the temperature nears the freezing point the indicated accretion rate becomes less than the original rate. In this condition very little ice forms, and most of the impinging water runs around the tube and blows off. Thus, an increased icing time is required to obtain a fixed Ap giving a lower indicated icing rate. The interrelation of air temperature, icing rate, and airspeed, which initiates the runoff condition on the sensing probe, is shown in figure 13. These relations were determined from the icing research tunnel studies and were used to establish regions of reliable operation for the icing meters.
In order to evaluate these assumptions, calculated water contents from the icing rate indications were compared with two other methods of measuring water content, rotating multicylinders (described in ref. 6) and an aeroscope {described in ref. 7). The multicylinder method is based on the principle that cylinders of different sizes collect different quantities of lce per unit frontal area, whereas the aeroscope collects and measures the individual cloud droplets though an oil medium and photographic technique. For the comparison studies these units were mounted in the proximity of two ice-sensing probes in an aircraft installation.
Simultaneous exposures to natural icing clouds were made with all instruments. The results are shown in figure 14 as separate comparisons of the icing meters with each method. Each data point in the figure represents a reading of water content indicated by each instrument averaged over the exposure distance of a multicylinder sample (4 to 14 miles). The points scatter about the lines for a ratio of 1 in both comparisons. The icing-meter readings averaged slightly greater than those of the multicylinders (mean line 0.01 g/cu m below the ratio line of 1) with an average deviation from the mean of 0.03 gram per cubic meter. Somewhat less agreement was found between the icing meters and the aeroscope with the meter readings averaging slightly less than those of the aeroscope (mean line 0.03 g/cu m above the ratio line of 1) and with an average deviation from the mean of 0.05 gram per cubic meter. The accuracy of water contents calculated from the icing meter indications cannot be easily evaluated from these comparisons, since the measurement errors in the other methods are not well established. These studies show that reasonably good agreement exists between icing-meter indications and those of two other methods of measuring water content in icing clouds.
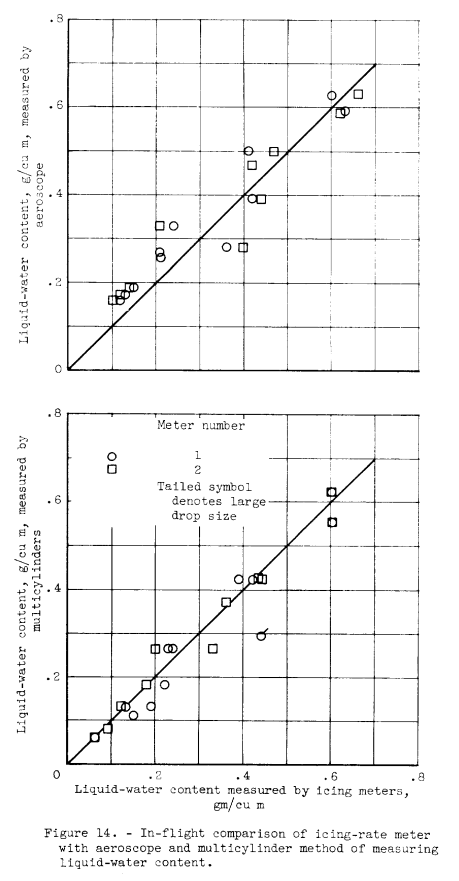
Note that some conditions are noted as "large drop size".
SUMMARY OF RESULTS
An extensive program of collecting icing-cloud data with instrumented airline and U. S. Air Force aircraft during routine flights has provided the following results:
Icing-cloud systems contained voids of varying length which resulted in separated periods of continuous ice buildup within a given system. For convenience, voids in the clouds exceeding 10 minutes of flight were not measured. This limitation defined a unit of cloud-system length called an icing encounter. Statistical values of many of the icing parameters were based on measurements taken within this unit of icing-cloud length.
A total of 3200 icing encounters were recorded by the cooperative organizations along airways within the United States, across the North Atlantic, along the Pacific air route to Alaska and Japan, and over wide arcas of the Pacific and Arctic oceans.
The following statistics were derived from frequency distributions of the measured icing parameters:
(a) Liquid-water content (averaged over 1-minute intervals of ice buildup):
(1) 0.3 Gram per cubic meter exceeded in approximately 33 percent of intervals
(2) 0.6 Gram per cubic meter exceeded in 10 percent of intervals
(3) 1.1 Grams per cubic meter exceeded in 1 percent of intervals
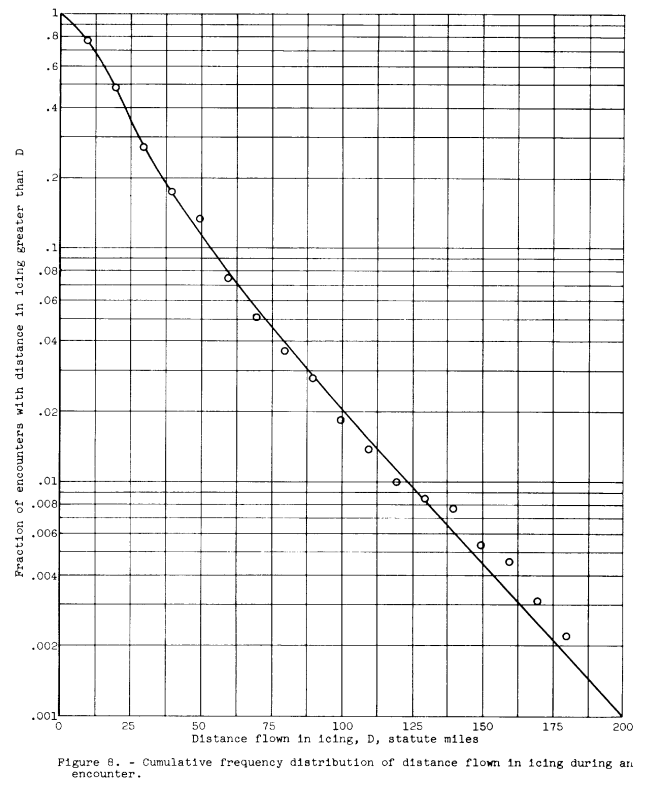
(b) Distance traveled within icing clouds (cumulative distance in icing throughout an encounter):
(1) 26 Miles exceeded in approximately 33 percent of icing encounters
(2) 53 Miles exceeded in 10 percent of icing encounters
(3) 120 Miles exceeded in 1 percent of icing encounters
(c) Depth of an icing-cloud layer:
(1) 1500 Feet exceeded in approximately 33 percent of icing-cloud layers
(2) 2700 Feet exceeded in 10 percent of icing-cloud layers
(3) 4700 Feet exceeded in 1 percent of icing-cloud layers
(d) Reference ice accretion (cumulative ice thickness on ice-sensing probe following icing encounter):
(1) 0.35 Inch exceeded in approximately 33 percent of icing encounters
(2) 0.85 Inch exceeded in 10 percent of icing encounters
(3) 2.3 Inches exceeded in 1 percent of icing encounters
(e) Temperature within icing clouds:
(1) Colder than -12° C in approximately 33 percent of icing encounters
(2) Colder than -20° C in 10 percent of icing encounters
(3) Colder than -32° C in 1 percent of icing encountersThe frequency distribution of liquid-water content showed a mean of 0.25 gram per cubic meter and a mode of 0.15 gram per cubic meter. The water contents of this distribution were about two-thirds of those derived from a distribution calculated from adiabatic lifting theory and a statistical procedure using the measured cloud-depth and temperature distributions.
Citations
References were cited at scholar.google.com these many times:
NACA-RM-E51D18: 5
NACA-RM-E52J06: 4
NACA-RM-E55F28a: 2
NACA-TN-3984: 10
NACA-TN-4314: 4
NASA Memo 1-19-59E: 5
Related
This is part of the Porter Perkins series.
For other reviews on meteorology, see Meteorology of Icing Clouds.
Notes
-
Perkins, Porter J., and Kline, Dwight B.: Analysis of Meteorological Data Obtained During Flight in a Supercooled Stratiform Clouds of High Liquid-Water Content. NACA-RM-E51D18, 1951. ntrs.nasa.gov ↩
-
Perkins, Porter J.: Preliminary Survey of Icing Conditions Measured During Routine Transcontinental Airline Operation. NACA-RM-E52J06, 1952. ntrs.nasa.gov ↩
-
Perkins, Porter J.: Statistical Survey of Icing Data Measured on Scheduled Airline Flights over the United States and Canada from November 1951 to June 1952. NACA-RM-E55F28a, 1955. ntrs.nasa.gov ↩
-
Perkins, Porter J., Lewis, William, and Mulholland, Donald R.: Statistical Study of Aircraft Icing Probabilities at the 700- and 500- Millibar Levels over Ocean Areas in the Northern Hemisphere. NACA-TN-3984, 1957. ntrs.nasa.gov ↩
-
Perkins, Porter J.: Icing Frequencies Experienced During Climb and Descent by Fighter-Interceptor Aircraft. NACA-TN-4314, 1958. ntrs.nasa.gov ↩
-
Perkins, Porter J.: Summary of Statistical Icing Cloud Data Measured Over United States and North Atlantic, Pacific, and Arctic Oceans During Routine Aircraft Operations. NASA Memo 1-19-59E, 1959. archive.org ↩↩