"In spite of the inconsistency it is believed that the data on mean-effective diameters are fairly reliable."
"A Further Investigation of the Meteorological Conditions Conducive to Aircraft Icing" 1
Summary
The value of the multicylinder data for determining drop size distribution is questioned.
Key points
- Two methods for determining drop size distributions are compared.
- The difference in water drop concentration around an aircraft body is proposed as an explanation for results from the two methods.
- A temperature effect of icing conditions is noted.
- Previously proposed design values from NACA-TN-1393 were verified.
Abstract
Meteorological data from flight observations in icing conditions during the winter of 1946-47 are presented. Data on liquid water content, temperature, and mean-effective drop diameter are shown to be consistent with values previously proposed for maximum icing conditions. Data on drop-size distribution as obtained by the rotating-cylinder method, although consistent with measurements previously made, were found to be inconsistent with data on drop-size distribution derived from the ratio of the maximum diameter to the mean-effective diameter when the maximum diameter was calculated from the area of impingement on a stationary cylinder. The relation between temperature and maximum liquid water content in layer clouds is discussed and estimates are given for the highest values of water content to be expected in layer clouds at various temperatures.
Discussion
INTRODUCTION
Over a period of several years, the NACA has conducted research on the prevention of ice formations on aircraft through the use of heat. The present phase of this research is intended to provide a fundamental understanding of the process of thermal ice prevention and thereby promote improvement in the design of thermal ice—prevention equipment. The meteorological results of the investigation, up to and including the 1945-46 winter season, have been presented in reference 1. The present report, which may be regarded as a supplement to reference 1, presents the results of additional flight measurements made during the winter of 1946-47. These data include results of flight observations with the XB-24M and XB-25E airplanes operated by the Flight Propulsion Research Laboratory at Cleveland, as well as the C-46 airplane operated by the Ames Aeronuutical Laboratory, Moffett Field, Calif.
Appreciation for cooperation in this investigation is extended to United Air Lines, Inc., the U.S. Weather Bureau, and the Air Materiel Command of the Army Air Forces. In particular, Major James Murray, Air Materiel Command, and Mr. Lyle Reynolds, United Air Lines, who were pilot and copilot, respectively, of the C-46 airplane, contributed materially to the research program.
APPARATUS AND METHOD
The equipment and test methods employed in the research of this report were identical to those described in reference 1 with the exception of a few changes discussed in the following paragraphs.
RESULTS AND DISCUSSION
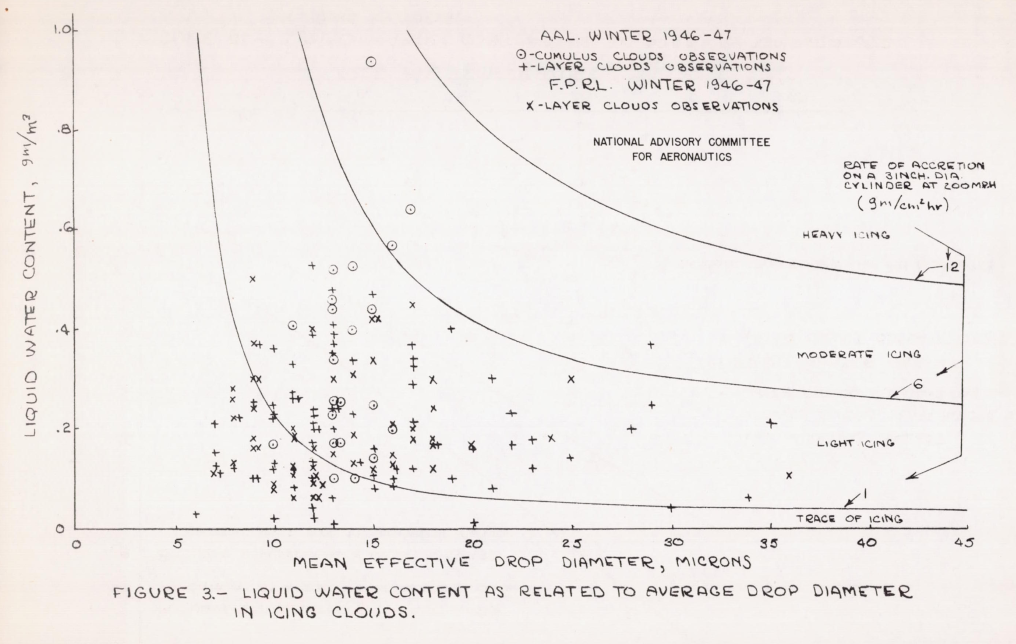
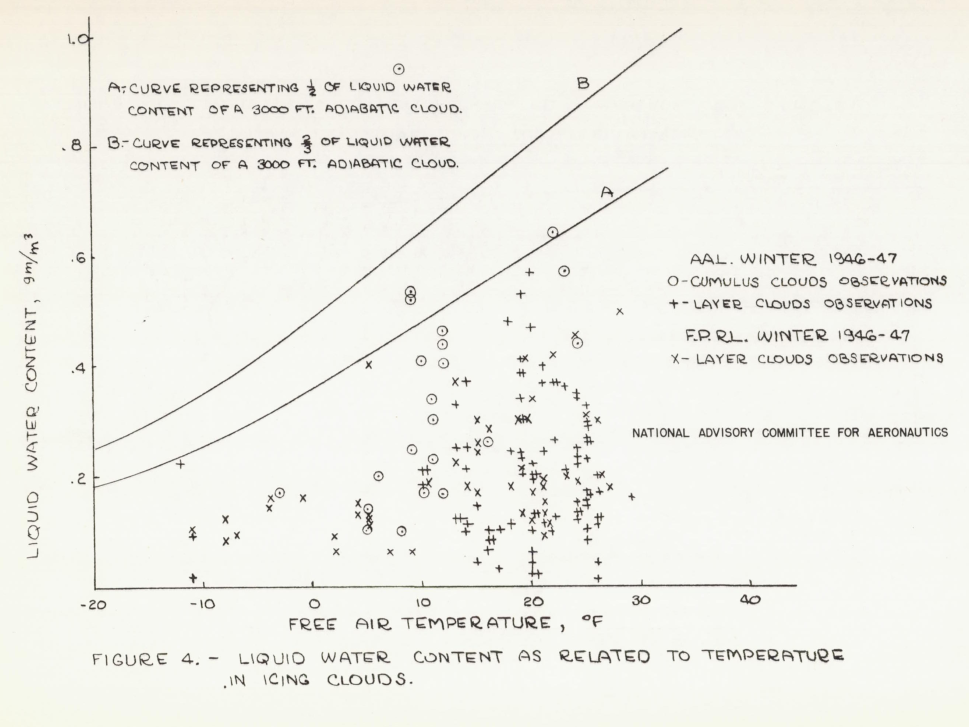
The data from the 1946-47 observations have been prepared in a form similar to that used for presentation in reference 1. Tables I and II present a summary of the data for both laboratories for all flights during which icing conditions were measured. Figure 3 presents the relation between liquid water content and mean-effective drop diameter and figure 4 shows liquid water content as a function of free—air temperature. The curves denoting intensity of icing in figure 3 represent the rate of ice accretion on a 3—inch diameter cylinder at 200 miles per hour as specified, by the Weather Bureau for reporting icing intensity from mountain—top observation stations.
Typical Icing Conditions
Estimates of the most severe icing conditions likely to be encountered in the course of all-weather transport operations in the United States have been presented in the foregoing section. Data on typical or average icing conditions and the relative frequency of various values of liquid water content and drop size are also of interest.
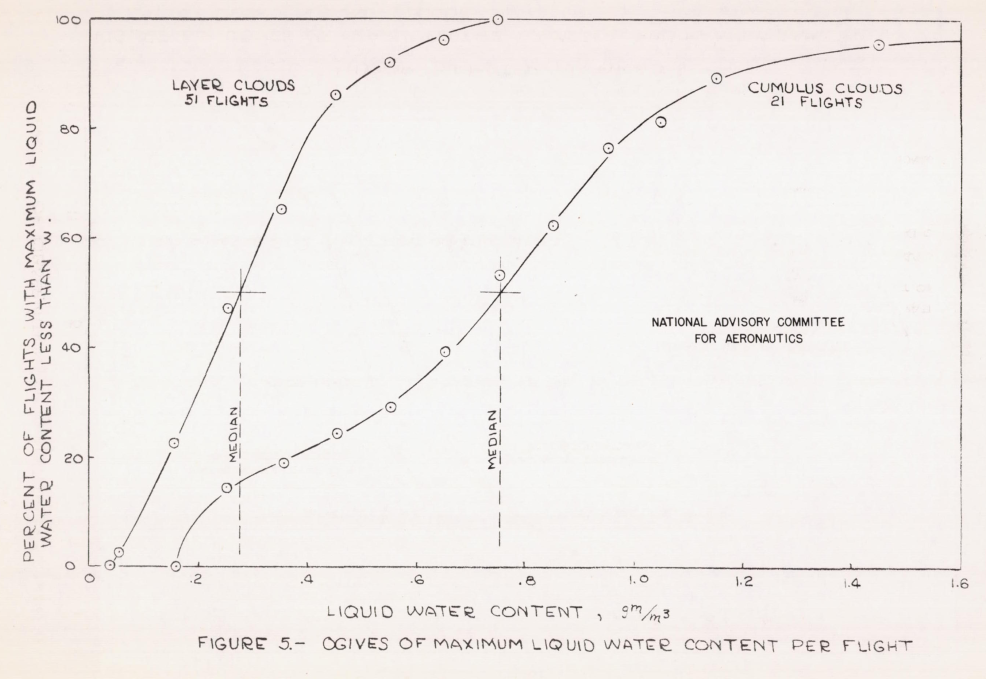
The highest values of liquid water content measured during each of 21 flights in cumulus clouds, 51 flights in layer-type clouds are presented in figure 5 in the form of ogives (cumulative frequency curves, reference 4). These curves include data from the Ames Aeronautical Laboratory for 1945-46 and 1946-47 and from the Flight Propulsion Research Laboratory for 1946-47. The median value of maximum liquid water content per flight is 0.76 gram per cubic meter for cumulus clouds and 0.28 gram per cubic meter for layer clouds. These values approximate those given in reference 1 for typical icing conditions. It is also noted from figure 5 that 90 percent of the flights in cumulus clouds encountered less than 1.2 grams per cubic meter and 90 percent of the flights in layer clouds encountered less than 0.5 gram per cubic meter.
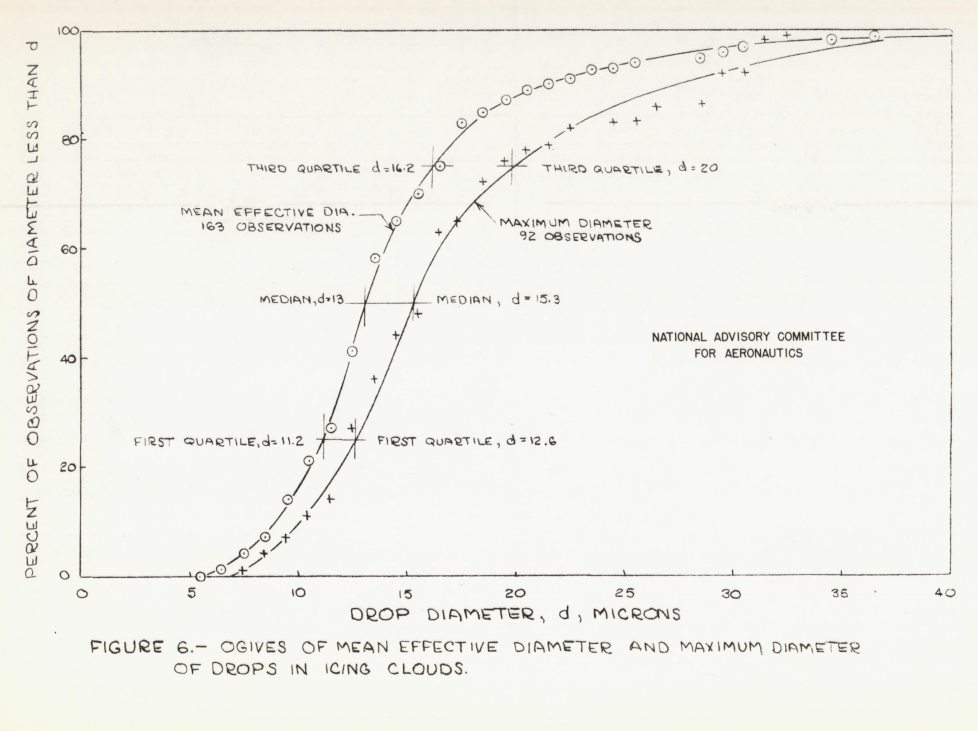
Ogives plotted from observations of mean-effective diameter and maximum diameter made during the 1946-47 season are presented in figure 6. It is noted that 50 percent of the observations of mean-effective diameter fall in the relatively narrow range from 11.2 to 16.2 microns; and 90 percent are less than 22 microns. Fifty percent of the observations of maximum diameter are between 12.6 and 20 microns and 90 percent are below 28 microns.
These distribution curves indicate that the icing conditions most commonly encountered are much less severe than the estimated maximum conditions. Thus, if it were assumed that most cumulus clouds and the most severe 10 percent of icing conditions in layer clouds could be avoided by proper meteorological navigation, it would only be necessary to protect against 0.5 gram per cubic meter at 13 microns or 0.3 grim per cubic meter at 20 microns. The extent to which meteorological navigation can be relied upon, however, can only be determined by an extensive study of the distribution of icing conditions in various weather situations and an analysis of air traffic control procedures.
Drops size distributions
The drop size distributions definitions and cylinder impingement analysis methods from 2 are used.
A comparison of two methods of determining the drop size distribution yielded rather different results.
Maximum Drop Size and Drop—Size Distribution
In the analysis of the test data the fact as noted that, in many cases, the maximum drop diameter as calculated from the area of impingement on the fixed cylinder was equal to or only slightly exceeded the corresponding mean—effective diameter calculated from the rotating—cylinder data. In a few cases the indicated maximum diameter was less than the indicated mean—effective diameter. This would indicate that in a majority of cases the size distribution was fairly uniform. The size distribution obtained by the rotating-cylinder method, on the other hand, frequently indicated broad distributions in cases where the comparison of the mean and the maximum diameters indicated uniform drop size. In order to check the consistency of these two methods of measuring drop—size distribution, they were expressed in terms of a common scale. To do this the assumption was made that the value of drop diameter contributing 10 percent of the water content in the assumed size distributions B, C, D, and E (reference 2) corresponds to the value of maximum drop diameter derived from the area of impingement on the stationary cylinder. Or the basis of this assumption, the ratio of the maximum diameter as measured by the area of impingcnent method to the mean—effective diameter as measured by the rotating—cylinder method was used to define a scale of size distributions as follows:
     Size distribution designation Maximum diameter
     (defined in reference 2) mean—effective diameter

               A                   below 1.16
               B                   1.17 to 1.41
               C                   1.42 to 1.62
               D                   1.63 to 1.87
               E                   1.88 and over
A comparison of the drop—size distribution obtained by the two methods is shown in the following frequency table::
Number of observations Size distribution, determined by the ratio of maximum diameter to mean—effective diameter
| * | A | B | C | D | E | Total |
|---|---|---|---|---|---|---|
| A | 21 | 10 | 1 | 1 | 1 | 34 |
| B | 3 | 6 | 3 | 1 | 1 | 14 |
| C | 8 | 4 | 0 | 1 | 2 | 15 |
| D | 4 | 4 | 0 | 0 | 0 | 8 |
| E | 8 | 4 | 2 | 5 | 2 | 21 |
| Total | 44 | 28 | 6 | 8 | 6 | 92 |
* Size distribution by the rotating-cylinder method |
Effect of the aircraft body on drop concentrations
A possible explanation for the differences was the positions of the instruments:
One possible explanation for this discrepency in the determination of drop—size distribution lies in the effect of the acceleration in the flow of air around the fuselage in locally modifying the water content, drop—size distribution, and velocity at the points where the rotating cylinders are exposed. Since the 1/8-inch cylinder is exposed nearly twice as far from the side of the fuselage as the 3-inch cylinder, it would appear that the local effects might apply variously to the different cylinders, thus giving rise to a false relationship between cylinder diameter and relative collection efficiency. Only a small change in the curvature of the line defining this relationship is sufficient to produce a significant change in the indicated drop-size distribution. This effect could be measured by the exposure of four rotating cylinders of equal diameters at positions normally occupied by the rotating cylinders. Any differences in the amounts of ice collected would be due to the local acceleration effects just mentioned.
For methods to assess the water drop concentration around a body, see 3 and 4.
Even with the differences in drop size distributions, it was noted in the conclusion that:
In spite of the inconsistency it is believed that the data on mean-effective diameters are fairly reliable.
A temperature effect on icing conditions
CONCLUDING REMARKS
In addition to verifying the specifications of maximum icing conditions proposed previously the data presented herein have been used to define the relation between temperature and maximum liquid water content in layer-type clouds as follows:
| Temperature F | Maximum liquid water content gm/m^3 |
|---|---|
| 20 | 0.8 |
| 0 | 0.5 |
| -20 | 0.25 |
The "maximum icing conditions proposed previously" are from NACA-TN-1393 5.
Citations
NACA-TN-1424 cites 4 publications:
- Lewis, William, Kline, Dwight B., and Steinmetz, Charles P.: A Further Investigation of the Meteorological Conditions Conducive to Aircraft Icing. NACA-TN-1424, 1947. ntrs.nasa.gov
- Tribus, Myron, and Tessman, J. R.: Report on the Development and Application of Heated Wings. AAF TR 4972, Add. I, Jan. 1946. (Available from Office of Technical Services, U. S. Department of Commerce as PB No. 18122.)
- Lewis, William: Icing Properties of Noncyclonic Winter Stratus Clouds. NACA-TN-1391, 1947. ntrs.nasa.gov
- Worthing, Archie G. and Geffner, Joseph: Treatment of Experimental Data. John Wiley and Sons, Inc. 1943.
NACA-TN-1424 is cited 19 times in an online search 6.
NACA-TN-1424 is cited 14 times in the NACA Icing Publications Database 7:
- Neel, Carr B., Jr., Bergrun, Norman R., Jukoff, David, and Schlaff, Bernard A.: The Calculation of the Heat Required for Wing Thermal Ice Prevention in Specified Icing Conditions. NACA-TN-1472, 1947. ntrs.nasa.gov
- Jones, Alun R., and Lewis, William: Recommended Values of Meteorological Factors to be Considered in the Design of Aircraft Ice-Prevention Equipment. NACA-TN-1855, 1949. ntrs.nasa.gov
- Lewis, William, and Hoecker, Walter H., Jr.: Observations of Icing Conditions Encountered in Flight During 1948. NACA-TN-1904, 1949. ntrs.nasa.gov
- Dorsch, Robert G., and Hacker, Paul T.: Photomicrographic Investigation of Spontaneous Freezing Temperatures of Supercooled Water Droplets. NACA-TN-2142, 1950. ntrs.nasa.gov
- Neel, Carr B., Jr., and Bright, Loren G.: The Effect of Ice Formations on Propeller Performance. NACA-TN-2212, 1950. ntrs.nasa.gov
- Hacker, Paul T., and Dorsch, Robert G.: A Summary of Meteorological Conditions Associated with Aircraft Icing and a Proposed Method of Selecting Design Criterions for Ice-Protection Equipment. NACA-TN-2569, 1951. ntrs.nasa.gov
- Kline, Dwight B., and Walker, Joseph A.: Meteorological Analysis of Icing Conditions Encountered in Low-Altitude Stratiform Clouds. NACA-TN-2306, 1951. ntrs.nasa.gov
- Lewis, William, and Bergrun, Norman R.: A Probability Analysis of the Meteorological Factors Conducive to Aircraft Icing in the United States. NACA-TN-2738, 1952. ntrs.nasa.gov
- Brun, Rinaldo J., Serafini, John S., and Moshos, George J.: Impingement of Water Droplets on an NACA 651-212 Airfoil at an Angle of Attack of 4°. NACA-RM-E52B12, 1952. ntrs.nasa.gov
- Dorsch, Robert G., and Brun, Rinaldo J.: Variation of Local Liquid-Water Concentration about an Ellipsoid of Fineness Ratio 5 Moving in a Droplet Field. NACA-TN-3153, 1954. ntrs.nasa.gov
- Brun, Rinaldo J., Lewis, William, Perkins, Porter J., and Serafini, John S.: Impingement of Cloud Droplets and Procedure for Measuring Liquid-Water Content and Droplet Sizes in Supercooled Clouds by Rotating Multicylinder Method. NACA-TR-1215, 1955. (Supersedes NACA TN’s 2903, 2904, and NACA-RM-E53D23) ntrs.nasa.gov
- Neel, Carr B., Jr.: A Heated-Wire Liquid-Water-Content Instrument and Results of Initial Flight Tests in Icing Conditions. NACA-RM-A54I23, 1955. ntrs.nasa.gov
- Perkins, Porter J.: Statistical Survey of Icing Data Measured on Scheduled Airline Flights over the United States and Canada from November 1951 to June 1952. NACA-RM-E55F28a, 1955. ntrs.nasa.gov
- Gelder, Thomas F., Smyers, William H., Jr., and von Glahn, Uwe H.: Experimental Droplet Impingement on Several Two-Dimensional Airfoils with Thickness Ratios of 6 to 16 Percent. NACA-TN-3839, 1956. ntrs.nasa.gov
Related Works
NACA-TN-1424 is cited by the three NACA publications cited in Appendix C of the icing regulations 8.
- Jones, Alun R., and Lewis, William: Recommended Values of Meteorological Factors to be Considered in the Design of Aircraft Ice-Prevention Equipment. NACA-TN-1855, 1949. ntrs.nasa.gov
- Hacker, Paul T., and Dorsch, Robert G.: A Summary of Meteorological Conditions Associated with Aircraft Icing and a Proposed Method of Selecting Design Criterions for Ice-Protection Equipment. NACA-TN-2569, 1951. ntrs.nasa.gov
- Lewis, William, and Bergrun, Norman R.: A Probability Analysis of the Meteorological Factors Conducive to Aircraft Icing in the United States. NACA-TN-2738, 1952. ntrs.nasa.gov
Notes
-
Lewis, William, Kline, Dwight B., and Steinmetz, Charles P.: A Further Investigation of the Meteorological Conditions Conducive to Aircraft Icing. NACA-TN-1424, 1947. ntrs.nasa.gov ↩
-
Langmuir, Irving, and Blodgett, Katherine B.: A Mathematical Investigation of Water Droplet Trajectories. Tech. Rep. No. 5418, Air Materiel Command, AAF, Feb. 19, 1946. (Contract No. W-33-038-ac-9151 with General Electric Co.) ↩
-
Dorsch, Robert G., and Brun, Rinaldo J.: Variation of Local Liquid-Water Concentration about an Ellipsoid of Fineness Ratio 5 Moving in a Droplet Field. NACA-TN-3153, 1954. ntrs.nasa.gov ↩
-
Brun, Rinaldo J., and Dorsch, Robert G.: Variation of Local Liquid-Water Concentration about an Ellipsoid of Fineness Ratio 10 Moving in a Droplet Field. NACA-TN-3410, 1955. ntrs.nasa.gov ↩
-
Lewis, William: A Flight Investigation of the Meteorological Conditions Conducive to the Formation of Ice on Airplanes. NACA-TN-1393, 1947. ntrs.nasa.gov ↩
-
Search in December, 2021 scholar.google.com. ↩