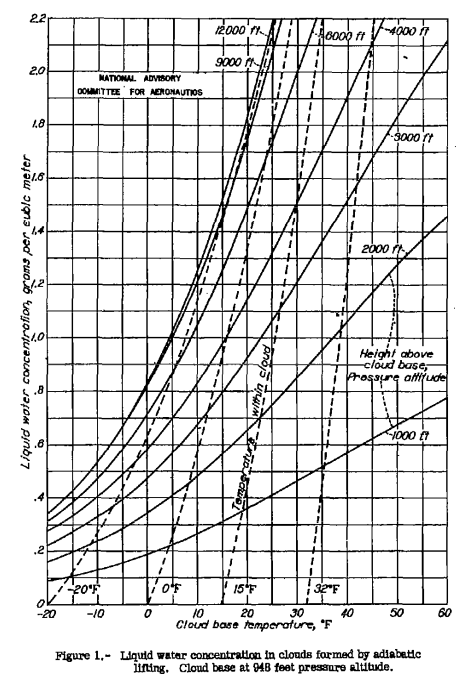
"liquid water concentration at any point in the cloud may be calculated by considering an air parcel lifted adiabatically from the condensation level"
"Icing Properties of Noncyclonic Winter Stratus Clouds"
Summary
Adiabatic lift theory is used to estimate the liquid water content of clouds.
Key Points
- Adiabatic lift theory is used to estimate the liquid water content of clouds.
- Drop size instrumentation was limited to a 4 inch cylinder for maximum drop size.
- "Calculations ... show that the liquid water concentration in noncyclonic stratus clouds is not likely to exceed 1.5 grams per cubic meter."
Abstract
Introduction
In order to establish a rational basis for the efficient design of thermal ice-prevention systems for airplanes the Ames Aeronautical Laboratory of the National Advisory Committee for Aeronautics has undertaken experimental investigation of the meteorological conditions conducive to the formation of ice on aircraft. A C-46 airplane has been equipped to measure free-water, air temperature, and drop size in clouds: The results of the free-water and air temperature measurements made in the 1942-43 season have been reported in reference 1 2.
The principal physical factors determining icing conditions are temperature, liquid water concentration, and drop-size. The meteorological conditions of icing involve the distribution of these three physical variables within clouds and precipitation of various types in various synoptic weather situations. This report presents results of observations of the distribution of liquid water concentration and drop size in winter stratus clouds in the absence of significant frontal or cyclonic activity. The observations were mace near Minneapolis, Minn., in November and December, 1944.
Discussion
As we saw in the Instruments Thread, the flight instrumentation was still being developed at the time of the flights (1944). So, a limited set was available for this test.
APPARATUS AND METHOD
Air temperature and free water concentration were measured essentially by the same methods discussed by Hardy in reference 1. 2
...
Drop sizes were measured by use of a cylinder which was covered with blueprint paper and extended for a few seconds into the air stream with its axis normal to the direction of motion. A 4 inch-diameter cylinder was chosen since it can be used to measure drop diameters from 8 to 35 microns at speeds from 120 to 200 miles per hour. The blueprint paper was exposed to light just prior to use to make it sensitive to small amounts of moisture drops on the cylinder caused wetting of a strip along the wind-ward side which was identified by a change of color of the blueprint paper. According to the theory of the movement of drops around a cylinder as developed by Glauert (reference 21) 3 the width of the area of impingement of drops is a function of the drop size, the airspeed, and the diameter of the cylinder. Data from Glauert's paper, corrected for deviations from Stokes' law, were used to draw a set of curves which give the drop diameter directly from the width of the area of impingement and the airspeed. These curves determine the diameter with an accuracy of about +/-2 percent; however, it must be kept in mind that these results contain any errors that may be present in Glauert's data. This method gives only the size of the largest drops that are present in sufficient quantity to affect the blueprint paper and tells nothing directly about the size distribution.
The quantity used in this report to represent drop size is the mass of one drop times 10a. This quantity, which is designated W100, represents the liquid water concentration in grams per cubic meter of a cloud having 100 such drops per cubic centimeter. If the drops are all the same size, the number of drops per cubic centimeter is obtained by dividing the measured liquid water by W100. If the size distribution is not uniform, the calculated number of drops will be too small.
METEOROLOGICAL DISCUSSION
Since the moist layer is characterized by nearly complete adiabatic mixing, it follows that the liquid water concentration at any point in the cloud may be calculated by considering an air parcel lifted adiabatically from the condensation level. The free water is found by taking the change in saturation mixing ratio, which represents the amount of condensed water in grams per kilogram of dry air and can be read from a pseudoadiabatic chart, and multiplying it by the number of kilograms of dry air per-cubic meter of saturated air to obtain the liquid water concentration in grams per cubic meter. The results of such calculations when the concentration (948 ft pressure altitude) pressure is taken as 980 millibars are presented in figure 1. A similar chart (fig.2) was prepared for a condensation pressure of 850 millibars (4,780 ft, pressure altitude). The two charts give the same values for liquid water concentration to within 0.1 gram per cubic meter for all values of condensation temperature below freezing and cloud thickness less than 1000 feet. This shows that the actual elevation of the cloud base, or condensation level, is of little importance and the significant factors are the temperature at the cloud base and the height above the cloud base.
Results and Discussion
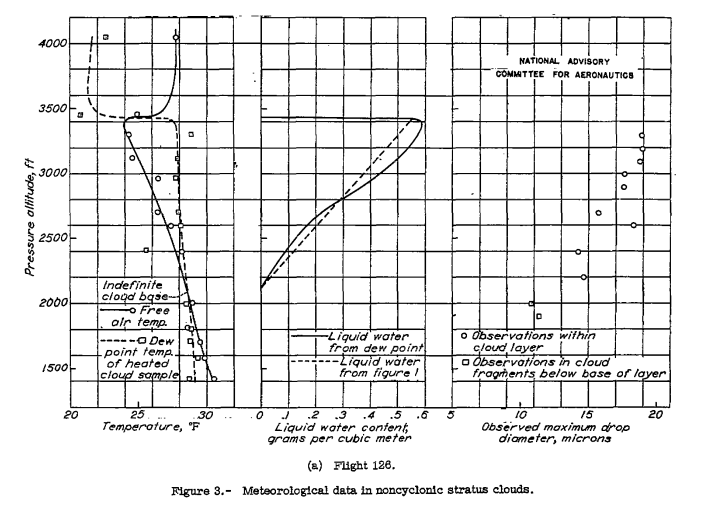
Representative temperature, dew-point, liquid water, and drop-size data as obtained during four flights through non-cyclonic stratus clouds are presented in figure 3. The values of W100 [largest drop size] obtained from individual observations have been plotted and are represented by a faired curve. Also presented in figure 3 are the droplet diameters in microns and values of N, both of which have been computed from the faired curve of W100 and the average drop diameter as calculated on the assumption that the value of N measured at the top of the cloud is the true value for the entire cloud layer.
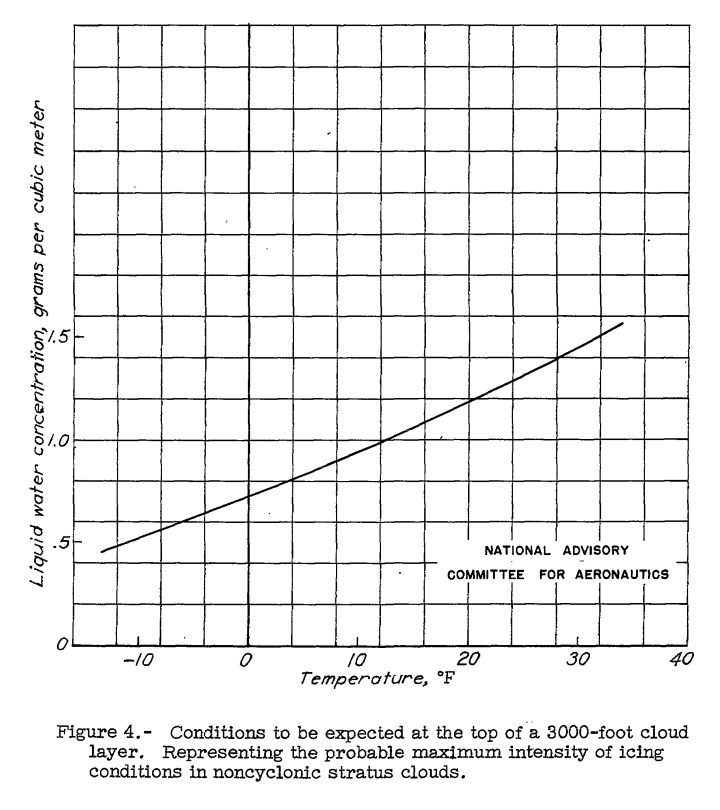
Since noncyclonic stratus clouds are formed within the surface turbulence layer, the thickness of this layer sets an upper limit to the thickness of the cloud layer. The highest stratus top encountered was at an altitude of 5300 feet which was about 4,500 feet above the ground. It is believed that this is about the upper limit of the height of the tops of clouds of this type. The maximum thickness observed was 2900 feet. There is much observational evidence to support the view that very low bases are seldom encountered in stratus when the tops are relatively high. It seems reasonable, then, to assume a case with a top 4,500 feet above the ground and a layer 3000 feet thick is representing a good approximation to the most unfavorable condition likely to be met. Figure 4 shows the relation between liquid water concentration and temperature at the top of a 3000-foot layer. This shows a water content of 1.5 grams per cubic meter at 32 F, which is the highest that is likely to occur at freezing temperatures. It should be noted that the formation of snow is much more likely at temperatures below 15 F, making the existence of thick water clouds less likely at these temperatures.
CONCLUSIONS
Observations made in noncyclonic winter stratus clouds indicate that if snow is not falling, the liquid water concentration can be approximately determined from the temperature of the base and the thickness of the layer by assuming moist-adiabatic lapse rate and constant total water content within the cloud.
The observations of drop size are not inconsistent with the theory that the number of drops per unit volume is constant throughout the layer and the size distribution is more uniform in the top than near the base.
The effect of snowfall is a progressive depletion of liquid water starting at the cloud base and continuing until only a thin layer of liquid water remains on the top of the cloud.
Calculations based on reasonable assumptions concerning maximum cloud thickness show that the liquid water concentration in noncyclonic stratus clouds is not likely to exceed 1.5 grams per cubic meter at temperatures below freezing.
The 1.5 grams per cubic meter limit for stratus clouds is high compared to later data.
Citations
NACA-TN-1391 cites references 2 and 3.
An online search (scholar.google.com) found NACA-TN-1391 cited nine times.
Notes
-
Lewis, William: Icing Properties of Noncyclonic Winter Stratus Clouds. NACA-TN-1391, 1947. ntrs.nasa.gov ↩
-
Hardy, J. K.: Measurement of Free Water in Cloud Under Conditions of Icing. NACA-ARR-4I11, 1944. ntrs.nasa.gov ↩↩↩
-
Glauert, Muriel: A Method of Constructing the Paths of Raindrops of Different Diameters Moving in the Neighbourhood of (1) a Circular Cylinder, (2) an Aerofoil, Placed in a Uniform Stream of Air; and a Determination of the Rate of Deposit of the Drops on the Surface and the Percentage of Drops Caught. R. & M. No. 2025, British A.R.C., 1940. ↩↩