"ice formation can be redefined in more general terms as a thermodynamic problem" 1 (1936)
Summary
The thermal analysis of icing conditions has unique challenges, including the determination of heat transfer coefficients and fraction of the surface wetted.
Key Points
- Measured heat transfer coefficients in dry air can be different between flight and tunnel tests, due to free stream turbulence.
- Icing conditions tend to promote more turbulent flow on the surface.
- Assumptions about the fraction of the surface wetted aft of impingement affect the thermal analysis.
Introduction
Experience indicates that certain types of control surfaces, for example, accumulate ice, while others do not. It suggests the need for particular care in the design of slotted controls, the more especially as de-icers can hardly be used in a slot. While of course much of this work can only be done in a refrigerated tunnel where practical tests of actual ice deposit can be made, there is more that can be done in any kind of a flowing stream if ice formation can be redefined in more general terms as a thermodynamic problem.
EXTRACTS FROM LETTER DATED APRIL 12, 1936, FROM HONORABLE EDWARD P. WARNER TO DR. J. S. AMES, NATIONAL ADVISORY COMMITTEE FOR AERONAUTICS. 1
[Emphasis added.]
These words from Edward Warner (a one-time NACA chief physicist, editor of Aviation magazine, and professor at MIT), outlined a general trend in the NACA icing studies for the next two decades. The studies moved from the early expeditious tests on specific component and aircraft (let us say prior to about 1949) to a more general and analytical understanding of icing.
The study of icing is complex, and while an understanding of icing thermodynamics may not be simple to attain, thermodynamics offers a path to analysis of aircraft icing, and a more general understanding of the icing challenges and solutions.
Several studies have been reviewed before, in the extensive Icing Thermodynamic thread, and other reviews:
- "An Investigation of Aircraft Heaters VIII - A Simplified Method for the Calculation of the Unit Thermal Conductance over Wings", NACA-WR-W-14, Mar. 1943.
> review: Combustion heated air - "An Analysis of the Dissipation of Heat in Conditions of Icing from a Section of the Wing of the C-46 Airplane", NACA-TR-831, 1945. (Formerly NACA-ARR-4I11a.)
> review: NACA-TR-831 - "The Calculation of the Heat Required for Wing Thermal Ice Prevention in Specified Icing Conditions", NACA-TN-1472, 1947.
> review: NACA-TN-1472 - Boelter, L. M. K., Grossman, L. M., Martinelli, R. C., and Morrin, E. H.: An Investigation of Aircraft Heaters XXIX - Comparison of Several Methods of Calculating Heat Losses from Airfoils. NACA-TN-1453, 1947. ntrs.nasa.gov
> review: Combustion heated air - "Analytical Investigation of Icing Limit for Diamond Shaped Airfoil in Transonic and Supersonic Flow", NACA-TN-2861, 1953.
> review: NACA-TN-2861 - "A Method for Rapid Determination of the Icing Limit of a Body in Terms of the Stream Conditions", NACA-TN-2914, 1953.
> review: NACA-TN-2914 - "Icing Protection for a Turbojet Transport Airplane: Heating Requirements, Methods of Protection, and Performance Penalties", NACA-TN-2866, 1953.
> review: Compressed air heat
In the review of NACA-TN-1472, we saw how heat transfer coefficients can be determined experimentally, by temperature measurements from a heated surface with a known heat flux (usually supplied by electrical heating).
Here, we look at NACA-TN-2480.
NACA-TN-2480, "Comparison of Heat Transfer from Airfoil in Natural and Simulated Icing Conditions" 2
SUMMARY
An investigation of the heat transfer from an airfoil in clear air and in simulated icing conditions was conducted in the NACA Lewis 6- by 9-foot icing-research tunnel in order to determine the validity of heat-transfer data as obtained in the tunnel. This investigation was made on the same model NACA 65,2-016 airfoil section used in a previous flight study, under similar heating, icing, and operating conditions.
The effect of tunnel turbulence, in clear air and in icing was indicated by the forward movement of transition from laminar to turbulent heat transfer. An analysis of the flight results showed the convective heat transfer in icing to be considerably different from that measured in clear air and only slightly different from that obtained in the icing-research tunnel during simulated icing.INTRODUCTION
The determination of the heat required for the protection of aircraft in icing has been the subject of considerable research by the NACA for a number of years. For specific aircraft, the heat required to realize an arbitrary temperature rise above the free-stream air temperature of the airplane surfaces that are subject to icing is determined, in reference 1. The development by Hardy (reference 2) of an analysis of the heat transfer from an airplane surface during icing provides a means of computing the heat requirements for specified icing conditions. The flight tests reported in reference 3 provide results for limited conditions, which, in general, substantiate the analysis of Hardy.
Icing investigations conducted in flight are difficult to control and time consuming. An investigation of the heat transfer from an airfoil in clear air and in icing over a range of controlled conditions was therefore conducted in the NACA Lewis icing-research tunnel.
A comparison of the heat-transfer results obtained in the icing-research tunnel with those obtained in flight using the same model airfoil and operating at similar conditions is presented herein.DESCRIPTION OF EQUIPMENT
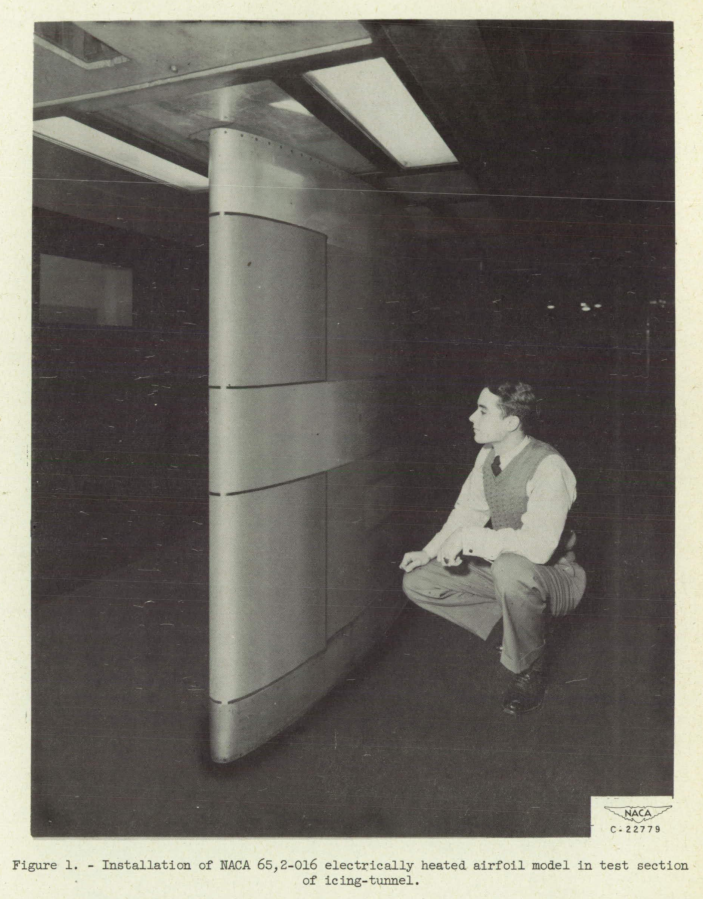
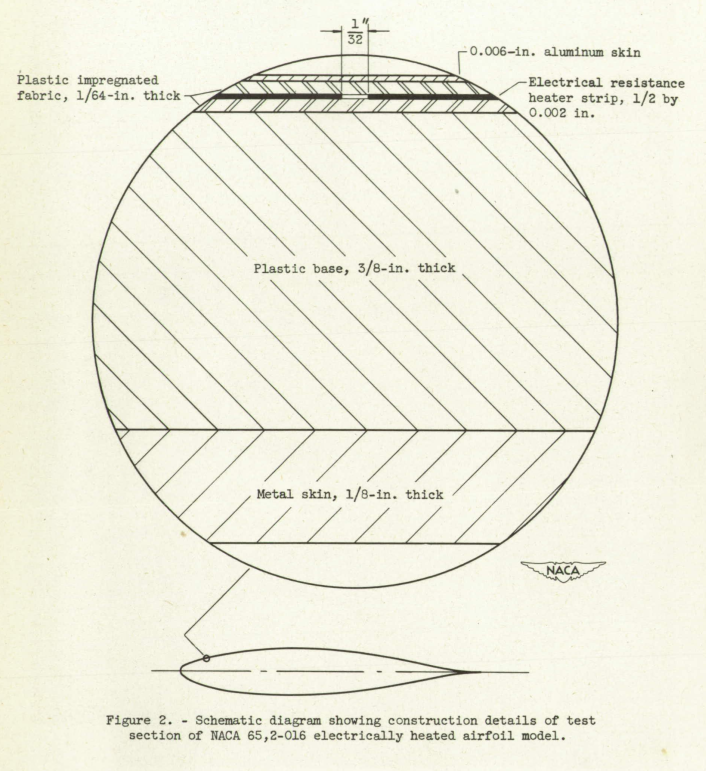
The model used in the tunnel investigation was an NACA 65,2-016 airfoil section having an 8-foot chord and a 6-foot span. With minor modifications required for the tunnel installation, it was the same model used in a flight investigation in natural icing conditions and is fully described in reference 3. The airfoil was vertically mounted in the tunnel as shown in figure 1. Construction details of the 1-foot-span electrically heated test section are given in figure 2. The 20 groups of heating elements in this area were arranged into 11 electric circuits selected to provide the most flexible chordwise adjustment of power distribution within the limits of the available facilities. The differences in power readings for heating elements common to the same circuit are caused by differences in resistance. This arrangement permitted a chordwise power distribution similar to that employed in the flight investigations. The heated length of the test strip extended to 55 percent of the chord length on the left side of the airfoil and to 17 percent of the chord length on the right side.
Simulated icing conditions were obtained in the test section of the tunnel by introducing liquid water into the air stream from eight NACA air-atomizing nozzles placed in four steam-heated struts located upstream of the tunnel test section. Initially the spray system was placed in the tunnel contraction section approximately 22 feet upstream of the model. For most of the investigation, the spray nozzles were located in the low-velocity section of the tunnel with a mixing distance from the nozzles to the model of 48 feet (fig. 3). The liquid-water content of the icing cloud was varied from approximately 0.3 to 1.5 grams per cubic meter by adjusting the nozzle water pressure; the mean-effective droplet diameter was varied from about 8 to 12 microns by adjusting the nozzle-air pressure. Liquid-water content, droplet size, and droplet-size distribution were determined by the rotating multicylinder method described in reference 4. The droplet-size distributions given in table I and defined in reference 4 are arbitrary size-frequency distributions based on measurements in natural icing with the A distribution denoting droplets of a single size.
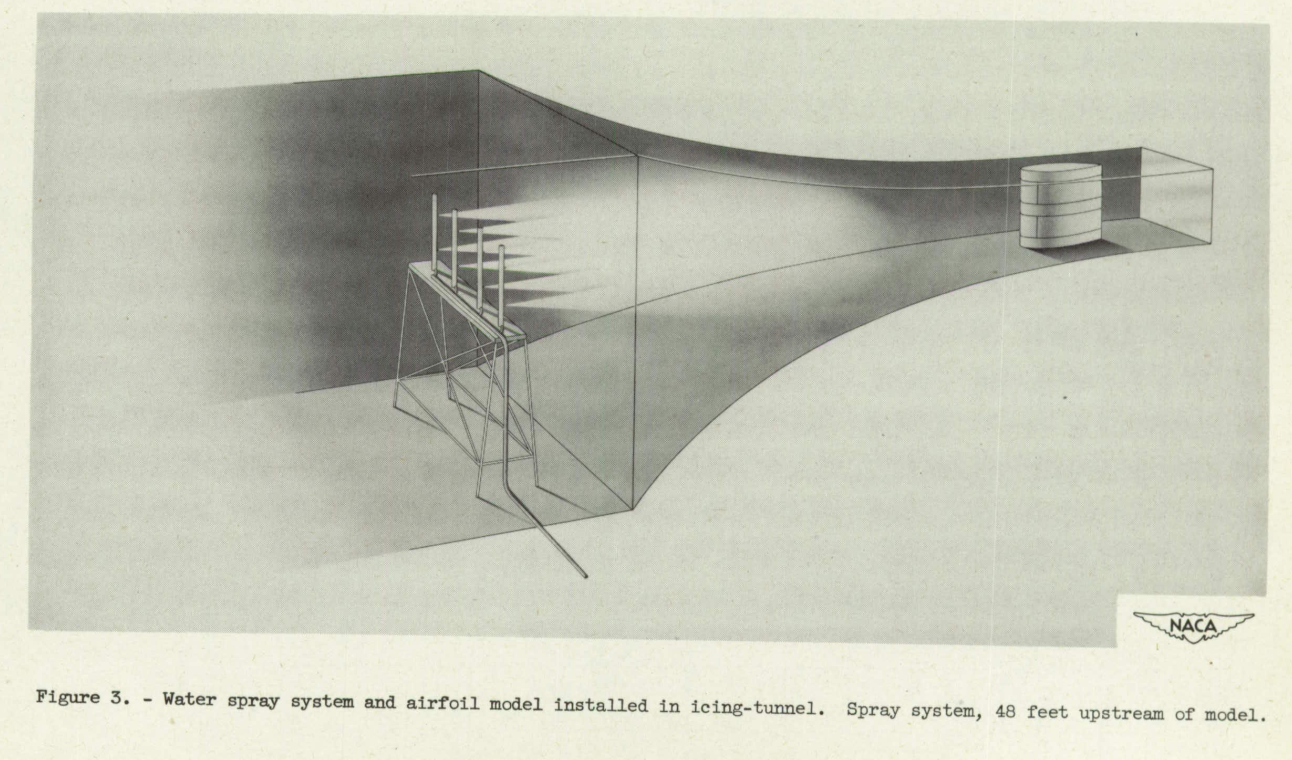
The spray system was removed for some runs, apparently to reduce free stream turbulence (see the discussion of Figure 8 below).
It is not clear to me why this spray system was used.
The nozzles are typically further upstream in the settling chamber.
NASA-SP-4306 3 notes that in 1950 nozzles similar to the current location
were installed in the Icing Research Tunnel.
Other tests that used the dye tracer technique to determine water
drop impingement rates used non-standard nozzle positions
similar to this, but the use of dye is not mentioned in NACA-TN-2480.
Reference 4 is Clark 4. As we saw in "A Langmuir B distribution is almost a normal distribution", this means that slightly different definitions for the droplet-size distributions were used than the now more familiar Langmuir distributions.
Surface-Datum Temperature
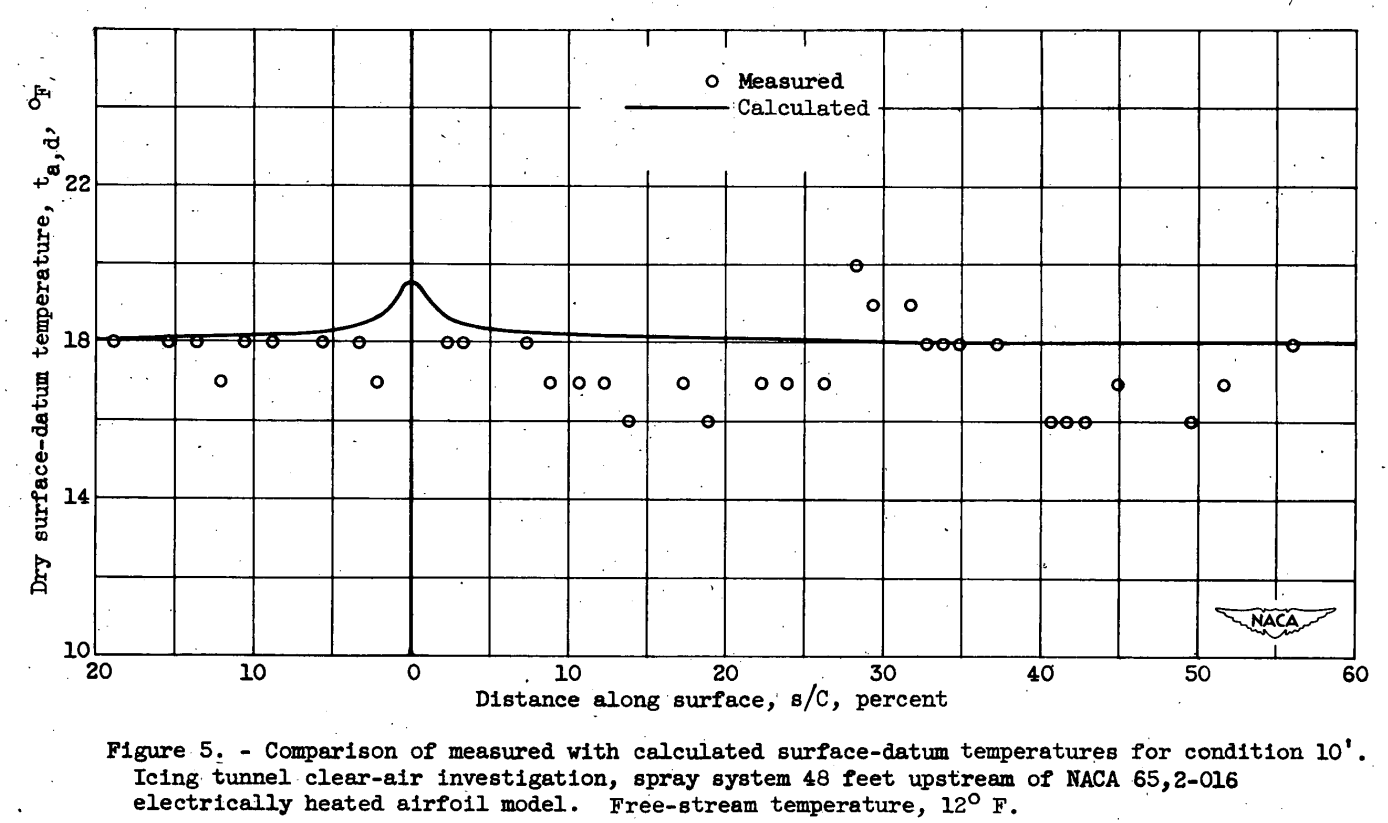
For the flight tests, the experimental surface-datum temperatures are not reported. In the icing-research tunnel, the surface-datum temperatures were measured in clear air for each operating condition. A comparison of the surface-datum temperatures measured in the icing-research tunnel in clear air with the value calculated from equation (4) is shown in figure 5 for condition 10'. The measured temperatures vary as much as 2 F from the calculated values, which is within the accuracy of measurement. The datum temperatures in a cloud that is below freezing cannot be measured directly because Of the release of heat by the freezing of the impinging water. For the flight conditions, the wet-datum temperatures were computed from equation (5). For tunnel conditions, the wet datum temperatures were calculated by deducting the temperature depression caused by evaporation from an average of the measured clear-air surface-datum temperatures.
Impingement and Evaporation Records of the impingement and the water flow over the airfoil surface were obtained by placing a water-sensitive material on the forward portion of the airfoil model. Typical records of this type are shown in figure 6. The results obtained in the tunnel and in flight were substantially the same. The solid areas on the records of figure 6 are the regions of direct water impingement in which the surface was fully wetted. Downstream of the limit of direct impingement the water breaks into individual streams or rivulets that tend to decrease in size and number. The weight rate of water impingement for one side of the airfoil model in pounds per hour per foot span and the limits of impingement were calculated for each condition by use of the water-droplet trajectories for a symmetrical, 12-percent-thick Joukowaki airfoil. The results of these calculations are given in table II.
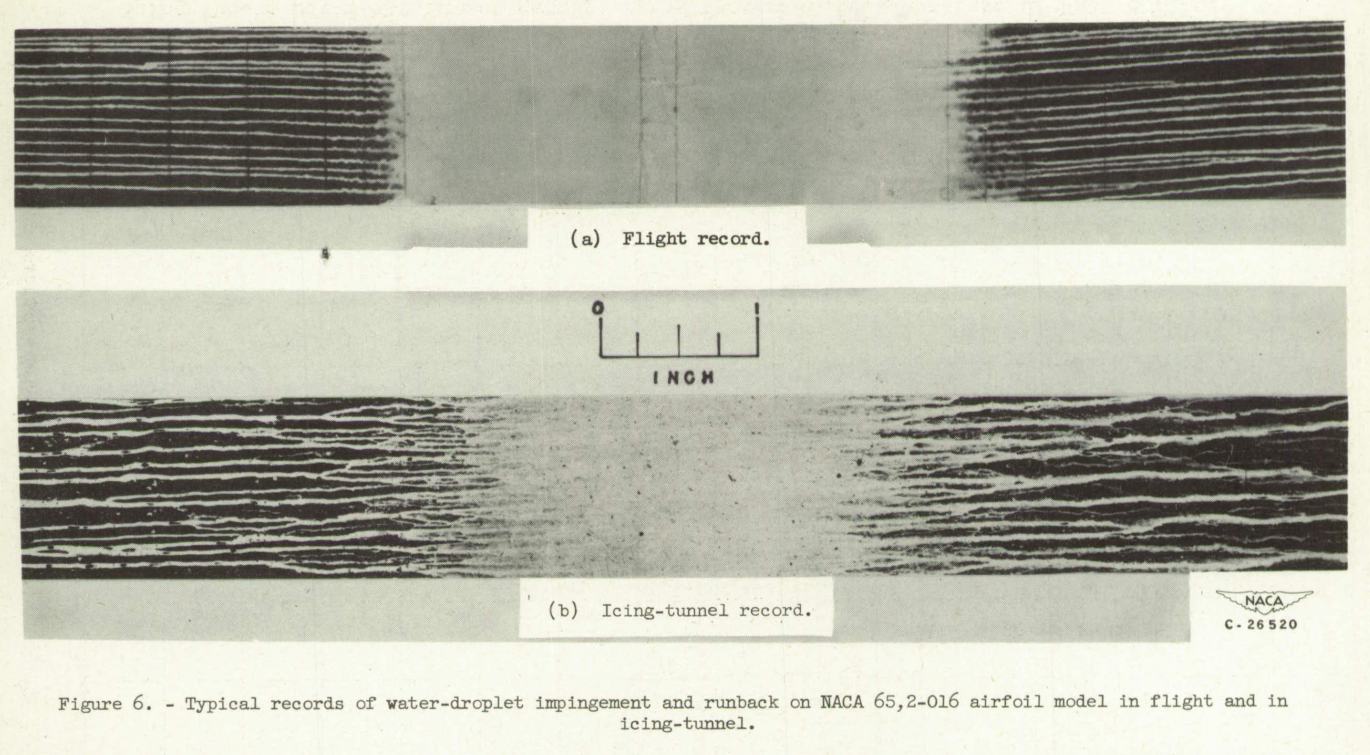
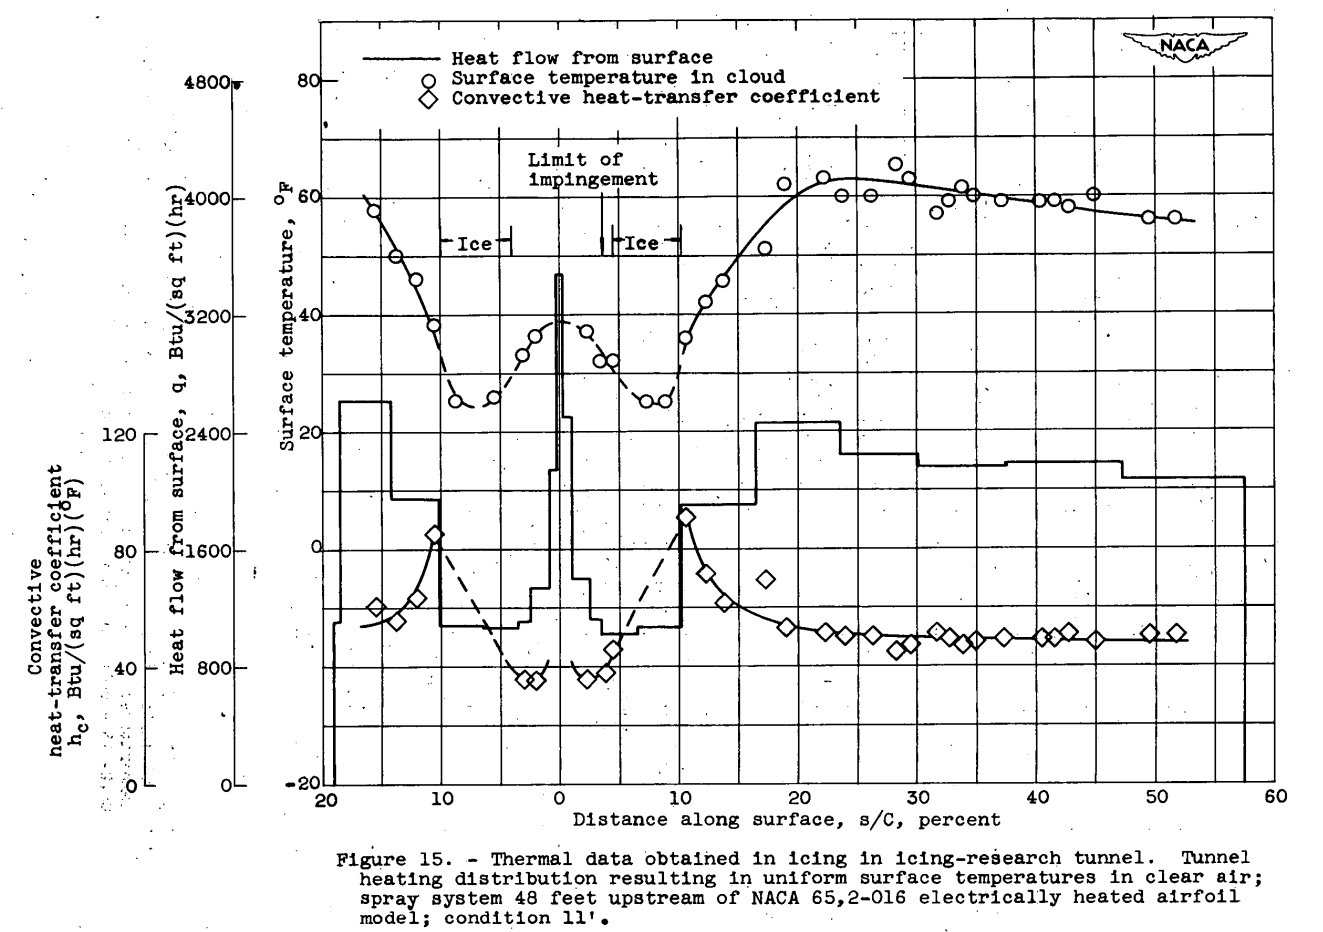
Figure 6 is similar to Figure 15, which we saw earlier
in the review of NACA-TN-1472.
NACA-TN-1472 is referenced in NACA-TN-2408.
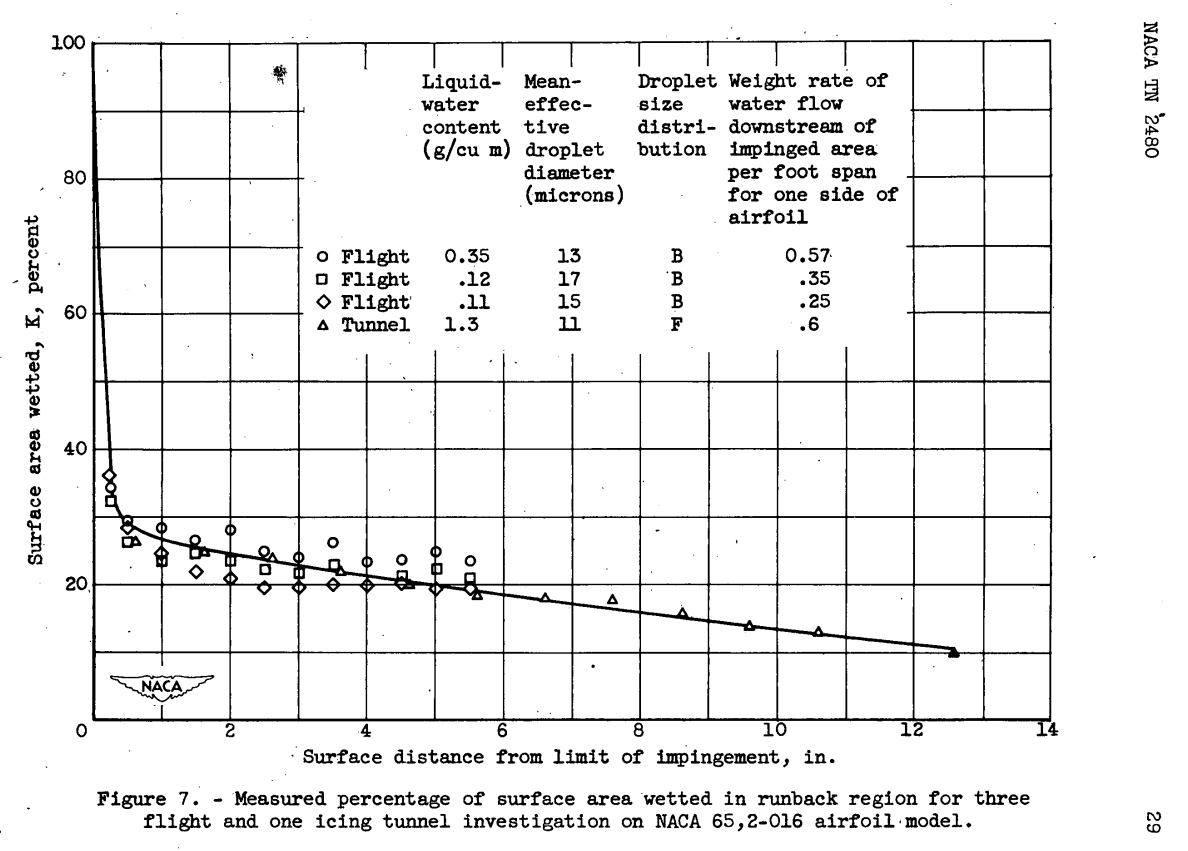
In the partly wetted area downstream of direct impingement, the rate of evaporation per unit area is less than in the fully wetted area. In the absence of detailed knowledge of the evaporation process in this partly wetted area, the full evaporation rate was decreased by a factor equal to the percentage of the total surface area that is actually wetted. From the flight and the tunnel records of impingement and runback as shown in figure 6, the actual area wetted by the runback rivulets was measured at various surface distances downstream of the limits of impingement. The results of these measurements are shown in figure 7. The wetness factor K decreases sharply from a value of 1 at the limit of impingement to a mean value of approximately 25 percent 1-inch downstream of the impingement limit and decreases slowly thereafter. The tunnel and flight measurements show agreement, which indicates that the flow process is substantially the same. Within the range of conditions investigated, no significant variation of the wetness factor with limit of impingement was noted. The actual degree of wetness probably does not follow a smooth curve. Although figure 6 reveals that several of the rivulets either stop or merge rather abruptly, in the hèat-transfer calculations of this report the wetness factor was regarded as continuously decreasing with distance as indicated in figure 7. Further refinement does not appear warranted from the data and lack of information regarding the evaporation process in this runback area. The calculated rates of evaporation and the limits of runback for each of the flight and the tunnel icing conditions are presented in table II.
Effect of Tunnel and Spray System in Clear Air
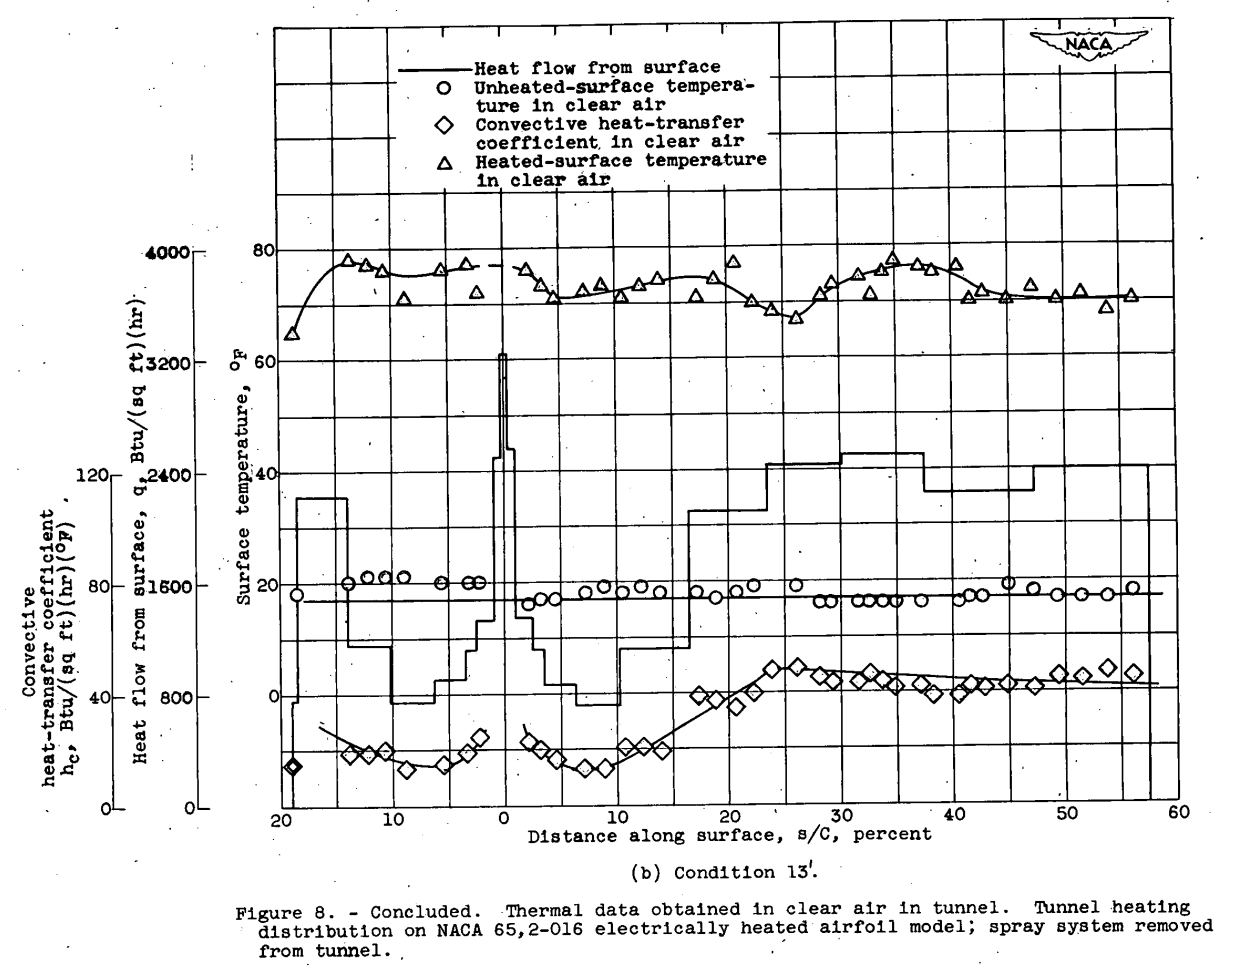
The initial heat-transfer measurements in the icing tunnel were made in clear air in order to determine the effect of the tunnel and the inoperative spray system on the convective heat-transfer coefficient. The results of these measurements are given in figure 8, which presents the heat flow from the surface, the heated and unheated surface temperatures, and the convective heat-transfer coefficient. The heat distribution used was experimentally determined as that producing an approximately uniform surface temperature.
When the spray system was not in the tunnel (fig. 8), raising the tunnel true airspeed from 138 to 194 miles per hour had no measurable effect on the location of the minimum convective heat-transfer coefficient, which remained at about 8-percent chord, whereas the location of the maximum coefficient moved forward from approximately 28- to 24-percent chord.
Additional Tunnel Results
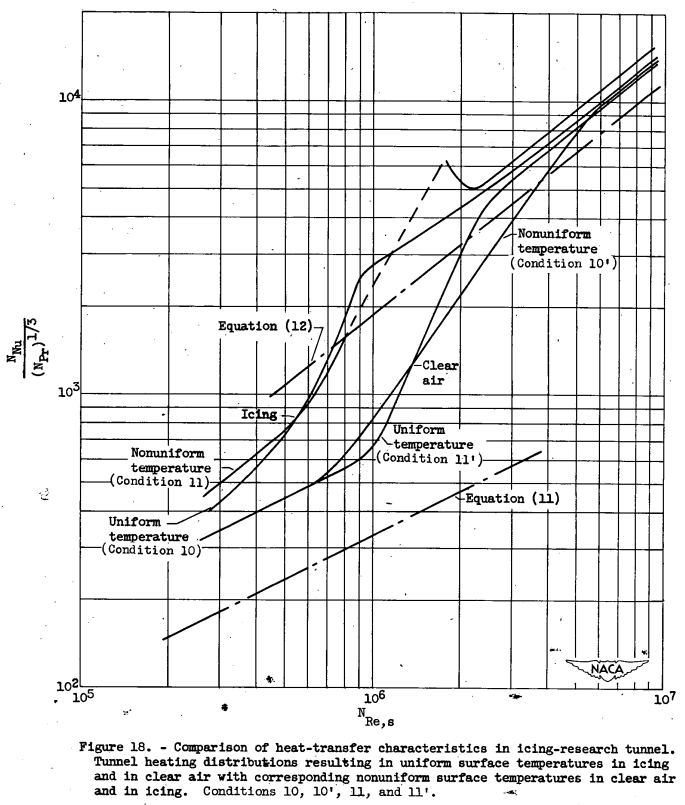
In addition to the tunnel investigation in which the flight heat distribution was used, studies were made with heat distributions that gave uniform surface temperatures in clear air and also in simulated. icing. The results obtained with a uniform surface temperature in clear air in the icing-research tunnel have already been presented in figure 9(c). The thermal data obtained with this same heat distribution during icing in the tunnel are given for condition 11' in figure 15. The original surface temperature, which was approximately 70 F in clear air, was sharply reduced in the first 20 percent of chord and a minimum temperature of 25° F was obtained, which resulted in ice formations. Photographs of these ice formations are shown in figure 16. The heat-transfer results are presented in the Nusselt correlation form in figure 17(a) together with a comparison with the clear-air curve. A marked forward movement of transition resulted from operation in icing with the actual transition beginning at approximately 2 percent of chord (fig. 15). The turbulent curve downstream of the ice formation follows the slope of the theoretical turbulent curve from equation (12), but is approximately 18 percent higher than the curve obtained in clear air at the same condition.
A comparison of the tunnel results for conditions 10, 10', 11, and 11' for both clear air and icing is presented in figure 18. The effects of the surface-temperature distribution in changing the point of initiation and rate of transition are shown to be relatively minor as compared with the difference between clear air and icing. All the experimental turbulent values agree with each other within approximately 15 percent, but average about 30 percent larger than the theoretical values from equation (12).
Comparison of Tunnel and Flight Results
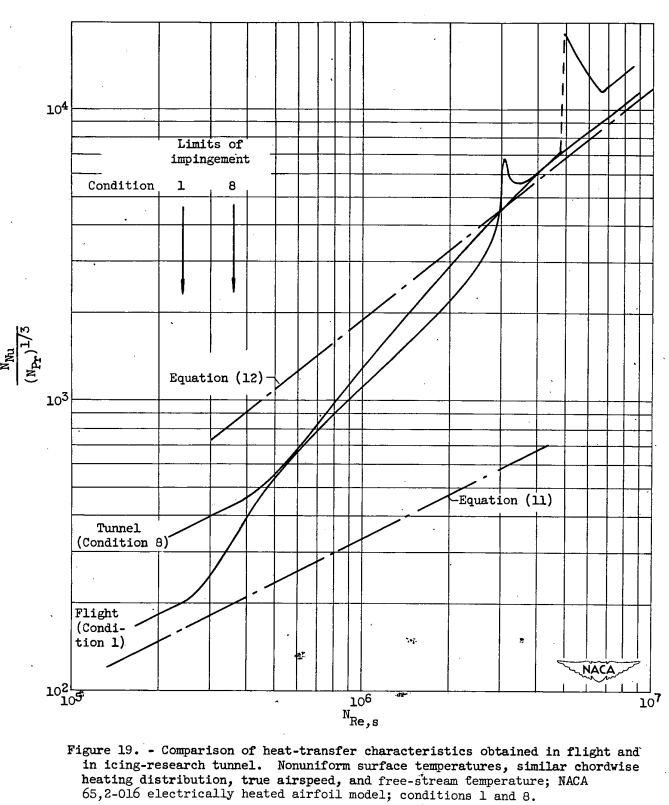
A comparison of the tunnel and flight results is shown in figure 19 for icing conditions 1 and 8. These conditions had approximately the same true airspeed, free-stream temperature, and limit of impingement; the same flight heat distribution that resulted in non-uniform surface temperatures in icing was used for both. No comparison is made for the case of uniform surface temperatures in icing inasmuch as such results were not obtained in the flight investigation. The greatest discrepancy between the tunnel and flight results of figure 19 occurs in the laminar region at a local Reynolds number of 3X10^5 and in the turbulent region at a local Reynolds number of 3X10^6 where large peaks for both flight and tunnel result from sudden increases in heat input at this region. In the transition region, a better comparison is obtained; the tunnel results are approximately 5 to 30 percent higher than the flight results. The data for these two conditions (figs. 14(a) and 12(c)) show a scatter of approximately 15 percent during transition. In the turbulent region, the results agree within 10 percent except for the large peaks caused by the discontinuity of the heat distribution.
SUMMARY OF RESULTS The results of the investigation of heat transfer from an airfoil in the icing-research tunnel may be summarized as follows:
1. The pattern of the runback rivulets and hence the degree of surface wetness were substantially the same for both the tunnel and flight results.
2. The inherent turbulence level of the tunnel caused a forward movement of transition from laminar to turbulent heat transfer in clear air with a semilaminar region obtained at local Reynolds numbers of less than 10^6.
3. The impingement of water on the airfoil model in both flight and in the icing-research tunnel caused a forward movement of transition. During the flight-icing conditions, only a very small region of laminar heat transfer resulted; no fully laminar heat transfer was obtained in the tunnel-icing investigations. Transition in the icing-research tunnel was initiated at local Reynolds numbers of from less than 3x10^5 to approximately 10^6 with full turbulent heat transfer being achieved at local Reynolds numbers varying from approximately 8x10^5 to 4x10^6.
4. The type of heating and temperature patterns had measurable effects on the heat transfer.
5. The calculation of heating requirements based on the icing-research-tunnel convective-heat-transfer results will generally result in conservative values, that is more heat than necessary should be available to cope with the particular icing situation. The amount by which the heating requirements are conservative is dependent on the specific design conditions.
Conclusions
The determination of heat transfer coefficients is necessary for detailed icing thermal analysis. However, there are limits to the accuracy of the values calculated or measured.
A heat transfer textbook 5 advises when using heat transfer correlations (for dry air conditions):
The foregoing correlations are suitable for most engineering calculations. However, they should not be viewed as providing exact determinations of the coefficients. Conditions may vary according to the freestream turbulence and surface roughness, and it would be unreasonable to expect the correlations to predict results to better than 25% accuracy. This statement made be made for virtually all the correlations to be considered.
NACA studies that measured heat transfer coefficients only estimated some errors in the process. I would estimate the potential errors in measurement to be of the same order of magnitude (+/-25%) as that noted for correlations above.
The situation is more complex for icing conditions. Water drops flowing through the heated surface boundary layer may disturb the flow. Liquid water or ice on the surface provides roughness that is not there in dry conditions. Icing wind tunnels have some free stream turbulence, enhanced by the water spray nozzles. Current CFD methods are challenged to account for these effects. However, Figure 19 above shows heat transfer coefficients approaching the values calculated for turbulent flow, so that appears to be an upper limit, "except for the large peaks caused by the discontinuity of the heat distribution".
Calculating heat transfer coefficient is still a challenge. I recommend that the values not be treated single, "absolute truth" values. Calculations can be made with a range of heat transfer assumptions to make sensitivity of results quantitatively apparent.
The fraction of the surface wetted aft of the impingement zone is also a factor with variations. Some more recent analysis such as ADS-4, “Engineering Summary of Airframe Icing Technical Data” 6 use a fixed value (in the range of 0.2 to 0.25) in the runback area, while others such as LEWICE 7 calculate local values based on surface tension and flow calculations. SAE AIR 1168/4 8 assumes 0.6 averaged over the heated surface. For running wet conditions, the assumed value of fraction wetted can have a significant effect on calculated values.
See also
- Frick, Charles W., Jr., and McCullough, George B.: A Method for Determining the Rate of Heat Transfer from a Wing or Streamline Body. NACA-WR-A-40, Dec. 1942. ntrs.nasa.gov
- Gray, Vernon H.: Improvements in Heat Transfer for Anti-Icing of Gas-Heated Airfoils with Internal Fins and Partitions. NACA-TN-2126, 1950. ntrs.nasa.gov
- Lewis, James P.: An Analytical Study of Heat Requirements for Icing Protection of Radomes. NACA-RM-E53A22, 1953. ntrs.nasa.gov
- von Glahn, Uwe H.: Preliminary Results of Heat Transfer from a Stationary and Rotating Ellipsoidal Spinner. NACA-RM-E53F02, 1953. ntrs.nasa.gov
Notes
-
Hansen, James R.: "The Wind and Beyond. A Documentary Journey into the History of Aerodynamics in America", NASA-SP-4409 Vol. 2, Chapter 3, p. 529, EXTRACTS FROM LETTER DATED APRIL 12, 1936, FROM HONORABLE EDWARD P. WARNER TO DR. J. S. AMES, NATIONAL ADVISORY COMMITTEE FOR AERONAUTICS, 2003. ↩↩
-
Gelder, Thomas F., and Lewis, James P.: Comparison of Heat Transfer from Airfoil in Natural and Simulated Icing Conditions. NACA-TN-2480, 1951. ntrs.nasa.gov ↩
-
Dawson, Virginia P. "Engines and Innovation: Lewis Laboratory and American Propulsion Technology. NASA SP-4306." Engines and Innovation: Lewis Laboratory and American Propulsion Technology. NASA SP-4306, by Virginia P. Dawson, 271 pages, published by NASA, Washington, DC, 1991 4306 (1991) ntrs.nasa.gov. ↩
-
Clark, Victor F.: The Multicylinder Method. Mt. Wash. Observatory Monthly Res. Bull., vol. II, no. 6, June 1946. ↩
-
Incropera, F. P., De Witt, D. P.: "Fundamentals of Heat Transfer", John Wiley and Sons, 1984. ↩
-
Bowden, D.T, et.al., “Engineering Summary of Airframe Icing Technical Data”, FAA Technical Report ADS-4, General Dynamics/Convair, San Diego, California, 1964. apps.dtic.mil ↩
-
Wright, William. User's manual for LEWICE version 3.2. No. E-15537. 2008. NASA/CR—2008-214255 ntrs ↩
-
“Ice, Frost, and Rain Protection”, SAE Aerospace Applied Thermodynamics Manual, 1969 (regularly updated, currently document sae.org) ↩