"Complete information concerning the fundamental physical processes that determine the structure of clouds and cloud systems has necessitated a statistical approach to the problem."
"Investigation of Meteorological Conditions Associated with Aircraft Icing in Layer-Type Clouds for 1947-48 Winter"
Summary
Measured icing conditions in 1947-48 were consistent with prior measurements.
Key Points
- Measured icing conditions in 1947-48 were consistent with prior measurements.
- Cumulative-frequency graphs of indicate the frequency of various icing conditions.
- The Weather Bureau scale of icing intensity is used as a comparison to measured data.
Abstract
SUMMARY
Rotating-cylinder measurements of the icing conditions encountered in flight during the winter of 1947-48 are presented. Liquid-water content, drop size, and temperature data are shown to be consistent with previously measured conditions and with proposed maximum icing conditions in supercooled layer-type clouds. Cumulative-frequency graphs of meteorological parameters indicate the frequency with which various icing conditions have been encountered in the Great Lakes area and surrounding states.
Discussion
INTRODUCTION
One of the problems closely associated with the development of adequate and practicable thermal ice-prevention equipment for airplanes is the determination of the range of the pertinent meteorological variables that occur in icing conditions likely to be encountered during flight. One phase of the basic research on aircraft icing problems conducted by the NACA has therefore been an attempt to find and to fly in natural icing conditions for the purpose of measuring the meteorological factors associated with supercooled clouds.
Complete information concerning the fundamental physical processes that determine the structure of clouds and cloud systems has necessitated a statistical approach to the problem. The accumulation of considerable meteorological data over differing geographical and climatological regions in various weather conditions is therefore required before the design limits for ice-prevention systems can be stated with reasonable certainty.
APPARATUS AND METHOD
Rotating-Cylinder Measurements
Measurements of liquid water content, mean-effective drop diameter, and drop-size distribution were calculated from the weight of ice collected on each of four rotating aluminum cylinders of 1/8, 1/2, 1 1/4, and 3-inch diameters. The procedure used to calculate the desired quantities was similar to that outlined in reference 6, except that a density of 0.8 was assumed for all be deposits in calculating the average cylinder diameter during the exposure period. Because of flight conditions, this procedure was used in place of the more tedious, but slightly more accurate, method of measurement of the thickness of the ice deposited on each cylinder. For all computations the velocity in the vicinity of the cylinders. was assumed equal to the true airspeed of the airplane. Once a desired icing condition was encountered, as many runs as possible were made in order to approximate a continuous record of the cloud characteristics.
Free Air Temperature
Flight temperature measurements were made by means of a resistance-bulb thermometer shielded to eliminate radiation effects and direct impact of water. The thermometer was subject to kinetic heating because of the speed of the airplane. Corrections for the kinetic heating were obtained by the procedure outlined in reference 4.
Reference 4 is NACA-TN-1393.
...
Comparison of Data with Proposed Design Conditions
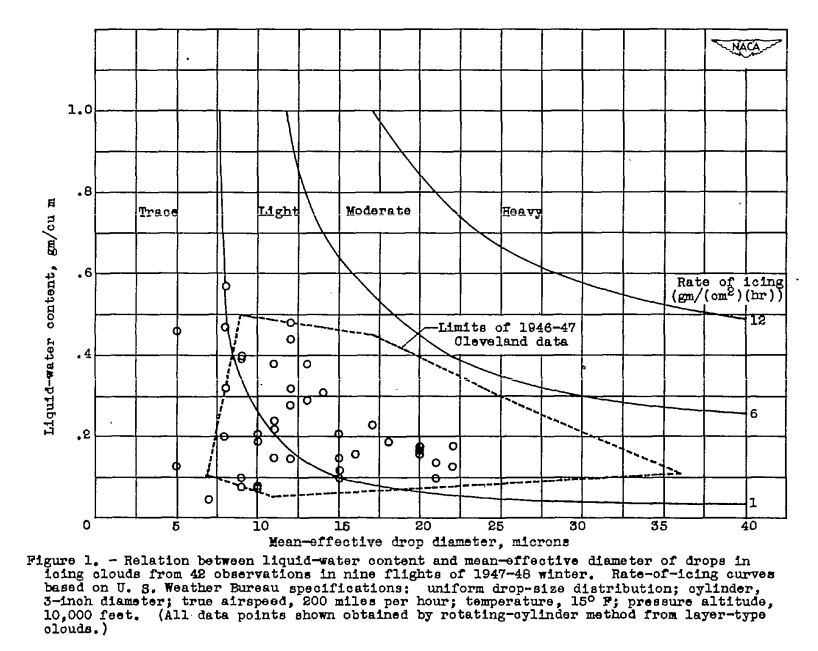
Tentative estimates of the most severe icing conditions likely to be encountered in flight are contained in reference 4. The values for stratus and stratocumulus clouds are:
| Liquid-water content (gm/cu m) | Temperature (°F) | Mean-effective drop diameter (microns) |
|---|---|---|
| 0.8 | 20 | 15 |
| 0.5 | 20 | 25 |
Examination of table I and figure 1 indicates that these proposed maximum conditions were neither equalled nor exceeded during the 1947-48 season. Whereas the first cylinder run of ice conditions approximates the estimated maximum conditions with respect to liquid-water content and temperature, the decreased collection efficiency of exposed airfoil surfaces due to the small drops considerably lessened the rate of ice formation.
Frequency-Distribution of Meteorological Parameters
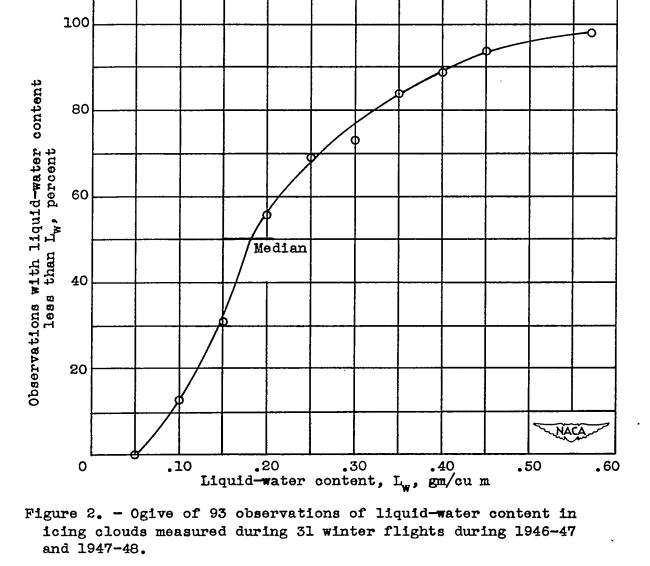
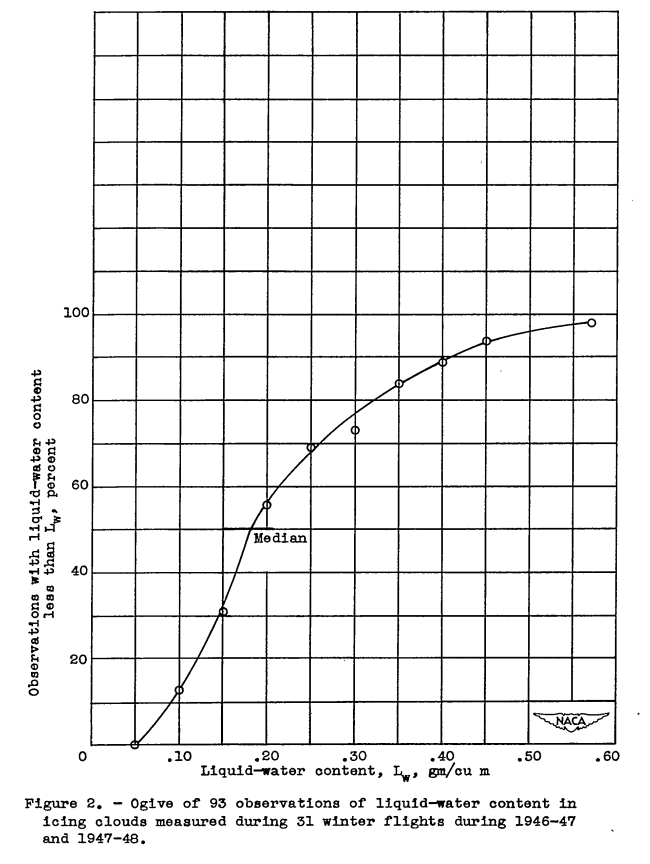
During the two seasons of ice flights from the Lewis laboratory, 31 flights were made in icing conditions during which 93 rotating-cylinder observations were collected. Nearly all the data were gathered in layer-type clouds, including nine observations in alto-stratus. Owing to the procedure of attempting to find, and to fly as long as possible, in the heavier-icing conditions, the data are believed to be weighted in favor of the more severe conditions that existed in the Great Lakes area and surrounding states. An ogive (emulative-frequency curve) based on observations of liquid-water content during the 1946-47 and 1947-48 seasons is shown in figure 2. A liquid-water content of less than 0.40 gram per cubic meter was measured in nearly 90 percent of the cases and 50 percent of all observations were made in conditions with less than 0.18 gram per cubic meter.
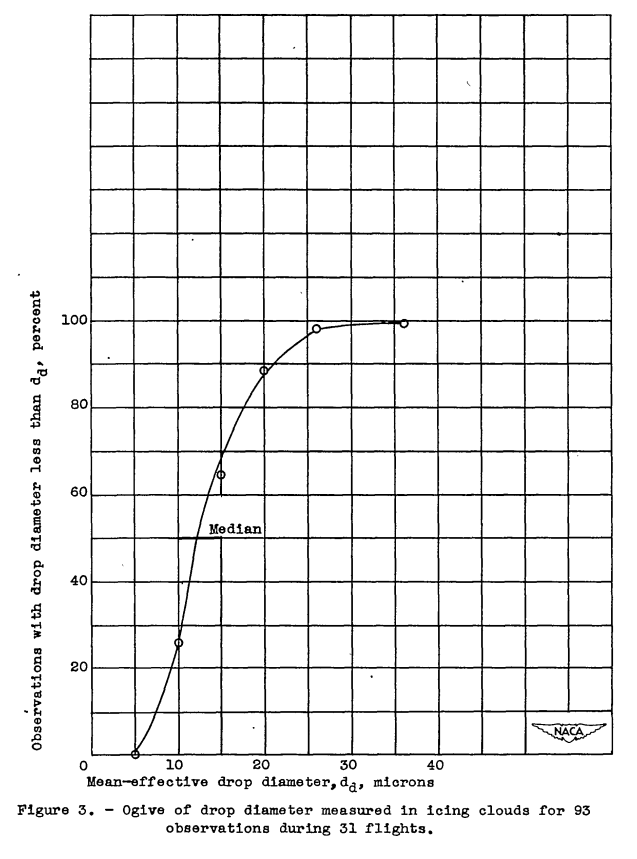
The ogive of drop-size measurements in figure 3 indicates that about 90 percent of the measurements of mean-effective diameter of the drops in icing clouds were less than 20 microns and 50 percent were less than 13 microns.
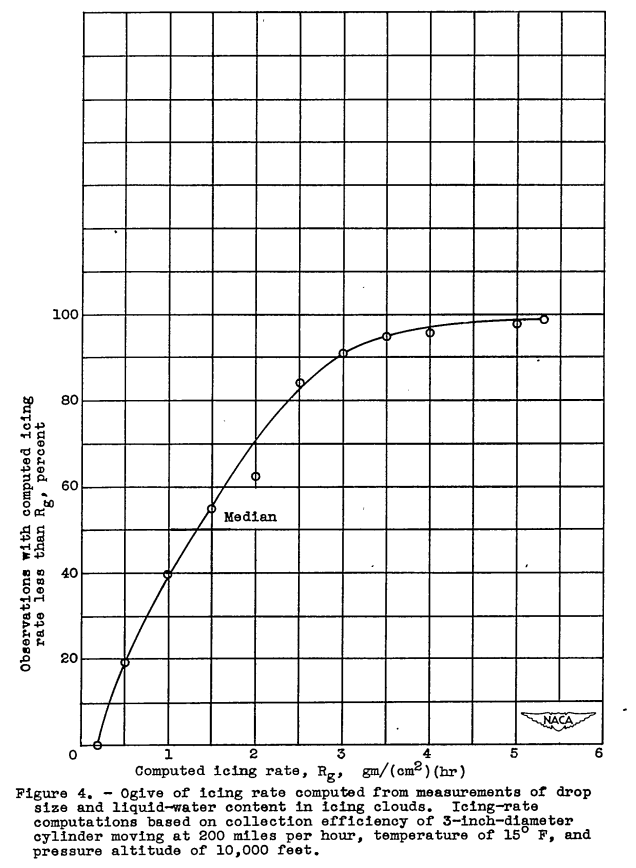
Because the actual icing intensity observed in flight is related to both the concentration of supercooled water and the drop sizes, computations have been made of the theoretical rate of ice accretion on a 3-inch-diameter cylinder, which roughly approximates the leading edge of at least part of an airplane wing. Although no simple measure of icing intensity is adequate for engineering purposes, the use of a 3-inch cylinder as a reference for icing-intensity measurements relates the observations to conditions that would normally be observed by a pilot.
Values for the collection efficiency for a 3-inch cylinder for various drop sizes were taken from reference 6. Figure 4 indicates that 90 percent of all measured icing conditions caused an icing rate of less than 3 grams per square centimeter per hour (1.5 in./hr, with an ice density of O.8). One-half of the observations were in icing conditions of less than 1.3 grams per square centimeter per hour (0.6 in./hr). The maximum condition observed so far has been 5.3 grams per square centimeter per hour, which is equivalent to about 2.6 inches per hour. The maximum design conditions for layer-type clouds specified in reference 4 give a computed icing rate of approximately 4 inches per hour when related to a 3-inch-diameter cylinder.
CONCLUSIONS
The following general conclusions are based on the observations gathered during two winter of icing flights from the Lewis laboratory:
1. In supercooled layer clouds that exist over the Great Lakes area, icing intensities are usually light (based upon the U. S. Weather Bureau scale of icing intensity in reporting icing conditions at mountain stations) but may occasionally approach an icing rate of moderate intensity.
2. Data collected during the two seasons indicate that the specifications of maximum icing conditions in terms of liquid-water content, mean-effective drop diameter, and temperature previously proposed for supercooled layer-type clouds appear to be adequate for the Great Lakes and surrounding regions.
Icing intensity scales
The Weather Bureau scale of icing intensity was used as a reference of comparison for measured icing conditions. The rationale was perhaps succinctly summarized later by Uwe von Glahn in 1955 2:
The collection of ice by the cylinders is similar to the collection of ice by airplane components. 1
The utility of the historic Weather Bureau scale of icing intensity or more recent icing intensity characterizations has been questioned.
Jeck 3 (2001) wrote of "Much confusion...":
This report traces the evolution of aircraft icing severity definitions and of the Federal Aviation Administration (FAA) regulations governing flight in icing conditions in order to understand the intent of each and how they relate to each other. There have been several changes in both the definitions and the regulations over time, and part of the problem is that the definitions have not been updated or clarified to account for current regulations. Much confusion has resulted and, in order to improve the situation, new and updated definitions have been recently proposed by a new working group established as part of the 1997 FAA In-Flight Icing Plan.
The proposal by Jeck has not been widely adopted.
The later SAE "Aircraft Inflight Icing Terminology" 4 (reaffirmed in 2013) states:
FAA publications currently contain a number of different definitions of icing intensity. In addition, new suggested definitions have been published by the FAA in the Federal Register but are not yet incorporated in any rules or advisory material.
...
This situation makes it inadvisable for SAE to recommend any definition of icing intensity terms at this time for the following reasons:
1. The current definitions in the Aeronautical Information Manual are unsatisfactory. The FAA has acknowledged their shortcomings in proposing these new definitions.
2. The intensity definitions have regulatory implications, as the terms are contained in the FAA operating rules.
3. The eventual inclusion of these definitions in theThe eventual inclusion of these definitions in the Aeronautical Information Manual will probably not be sufficient by itself for SAE to recommend their use. As stated in the Federal Register, use of the new definitions requires revisions of FAA regulations and advisory material and collaboration with the National Weather Service to achieve changes in forecasting consistent with these definitions. These are likely to be lengthy processes and may result in changes to the new suggested definitions.
I am not aware of significant changes to the icing intensity definitions since 2013.
Citations
An online search (scholar.google.com) found 15 citations for NACA-TN-1793.
Notes
-
Kline, Dwight B.: Investigation of Meteorological Conditions Associated with Aircraft Icing in Layer-Type Clouds for 1947-48 Winter. NACA-TN-1793, 1949. ntrs.nasa.gov ↩
-
von Glahn, Uwe H.: The Icing Problem, presented at Ottawa AGARD Conference. AG 19/P9, June 10-17 1955. ntrs.nasa.gov ↩
-
Jeck, Richard K.: A History and Interpretation of Aircraft Icing Intensity Definitions and FAA Rules for Operating in Icing Conditions. DOT/FAA/AR-01/91, November 2001. faa.gov ↩
-
Anon.: "Aircraft Inflight Icing Terminology.", APPENDIX A - DISCUSSION OF ICING INTENSITY TERMS DEFINITIONS, SAE ARP5624, 2013 www.sae.org ↩