Aircraft designs for flight in icing are improved and proven effective by several tools, including analysis, icing wind tunnel test, and flight test in icing conditions.
Design handbooks
Design handbooks have charts and tables that can be used to perform analyses for aircraft icing and ice protection.
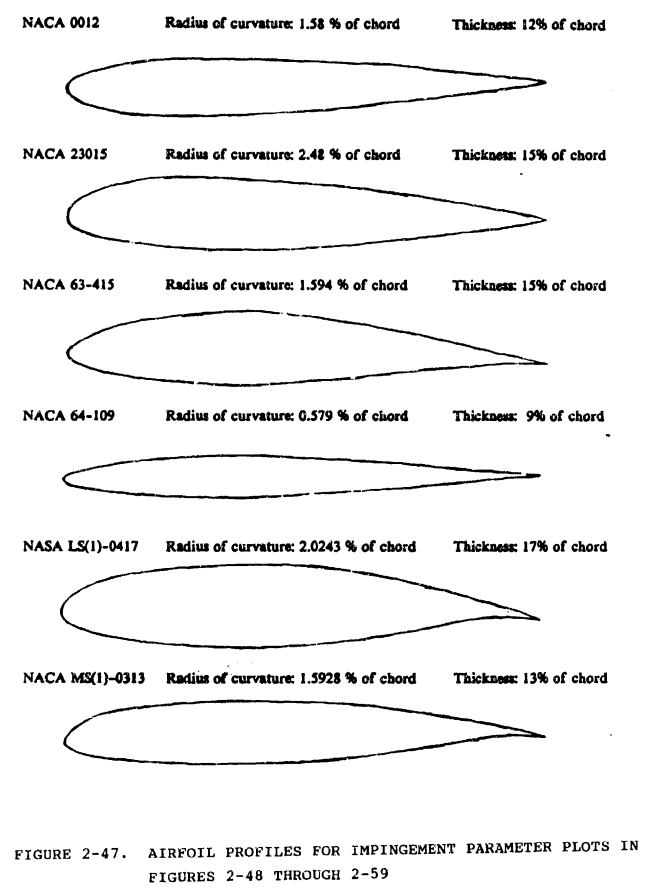
from "Aircraft Icing Handbook", DOT/FAA/CT-88/8 apps.dtic.mil
Analysis
There are computerized icing analysis tools available from NASA, and from commercial vendors. There is also "bespoke" software created for special purposes.
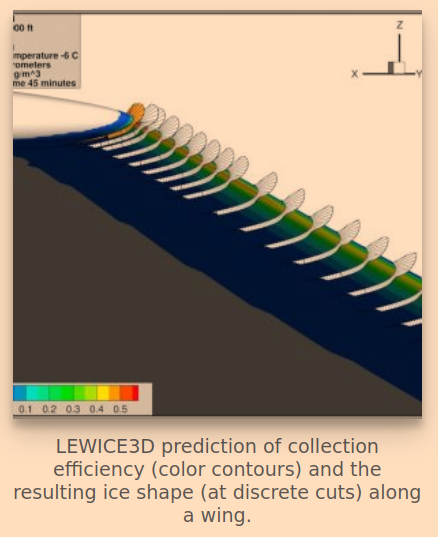
from "Glenn Research Center Software" www1.grc.nasa.gov
Laboratory tests
A wind tunnel is a large tube with a fan to produce air flow at a calibrated airspeed. Wind tunnels are used to study many effects on aircraft, including icing. Artificially produced ice shapes (often 3D printed) may be adhered to airplane models, and the effects studied.
To simulate in-flight icing conditions, "Icing Wind Tunnels" often use refrigeration to reach air temperatures below the melting point of ice, and water spray to produce drop sizes similar to those in nature (some do not have refrigeration, and wait for a day with cold enough weather for testing).
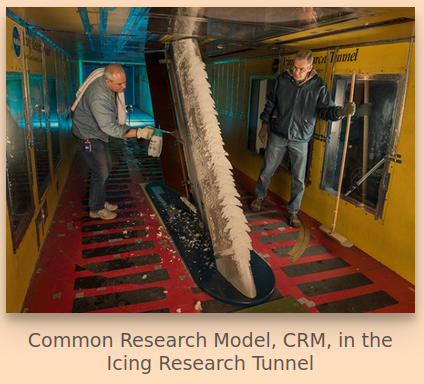
from "Glenn Research Center Icing Research Tunnel Facility Overview" www1.grc.nasa.gov
Flight tests
Flight tests are used to determine that ice protection systems operate as intended.
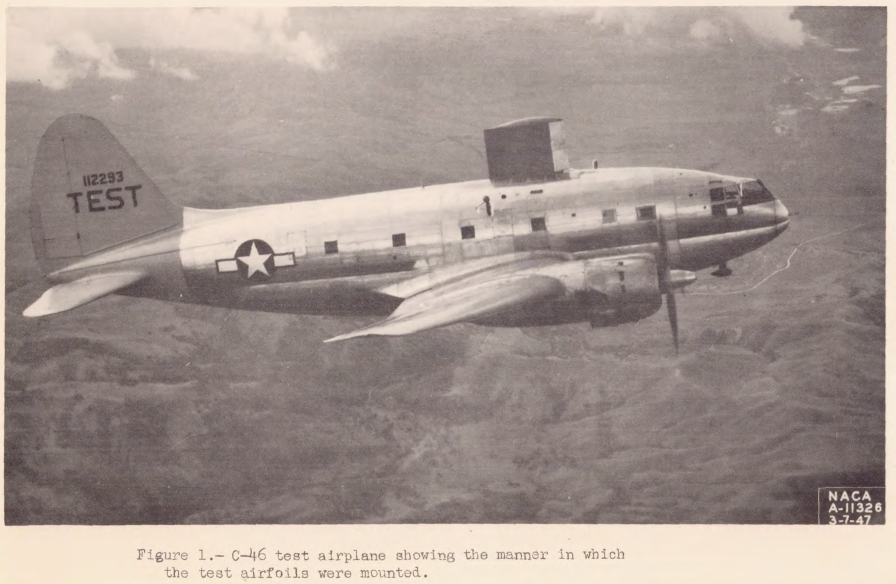
A research test flight from "NACA Conference on Aircraft Ice Prevention - A Compilation of the Paper Presented by NACA Staff Members on 26-27 June 1947" apps.dtic.mil
Flight tests may be conducted using artificial ice shapes.
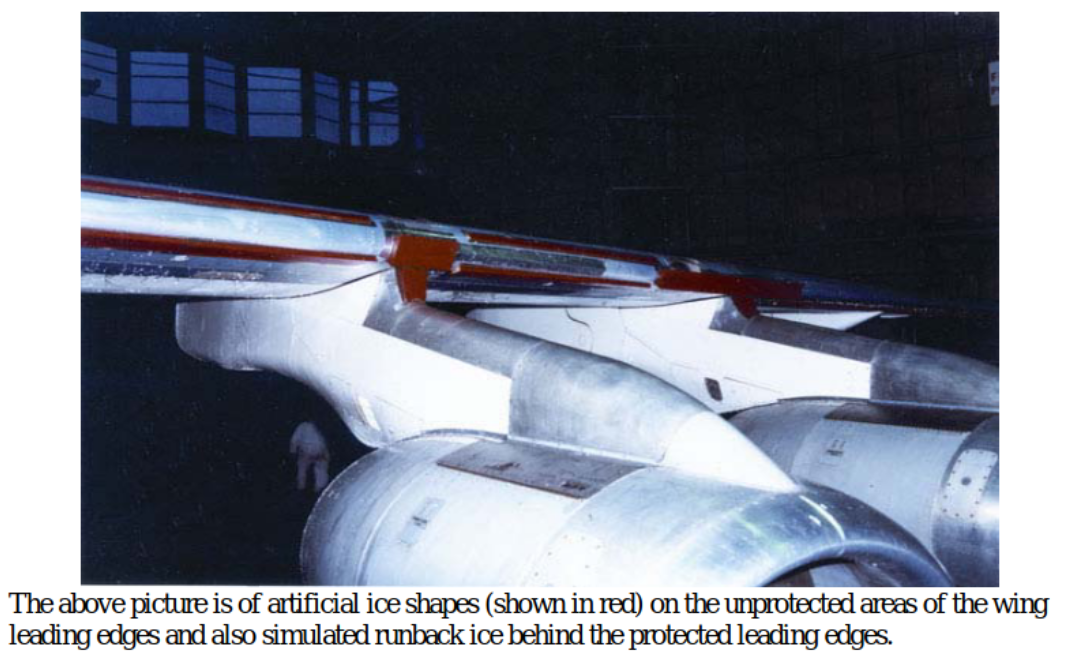
from "Introduction to Icing Certification" faa.gov
Flight test is one way of determining the effects of ice on the performance of the aircraft.
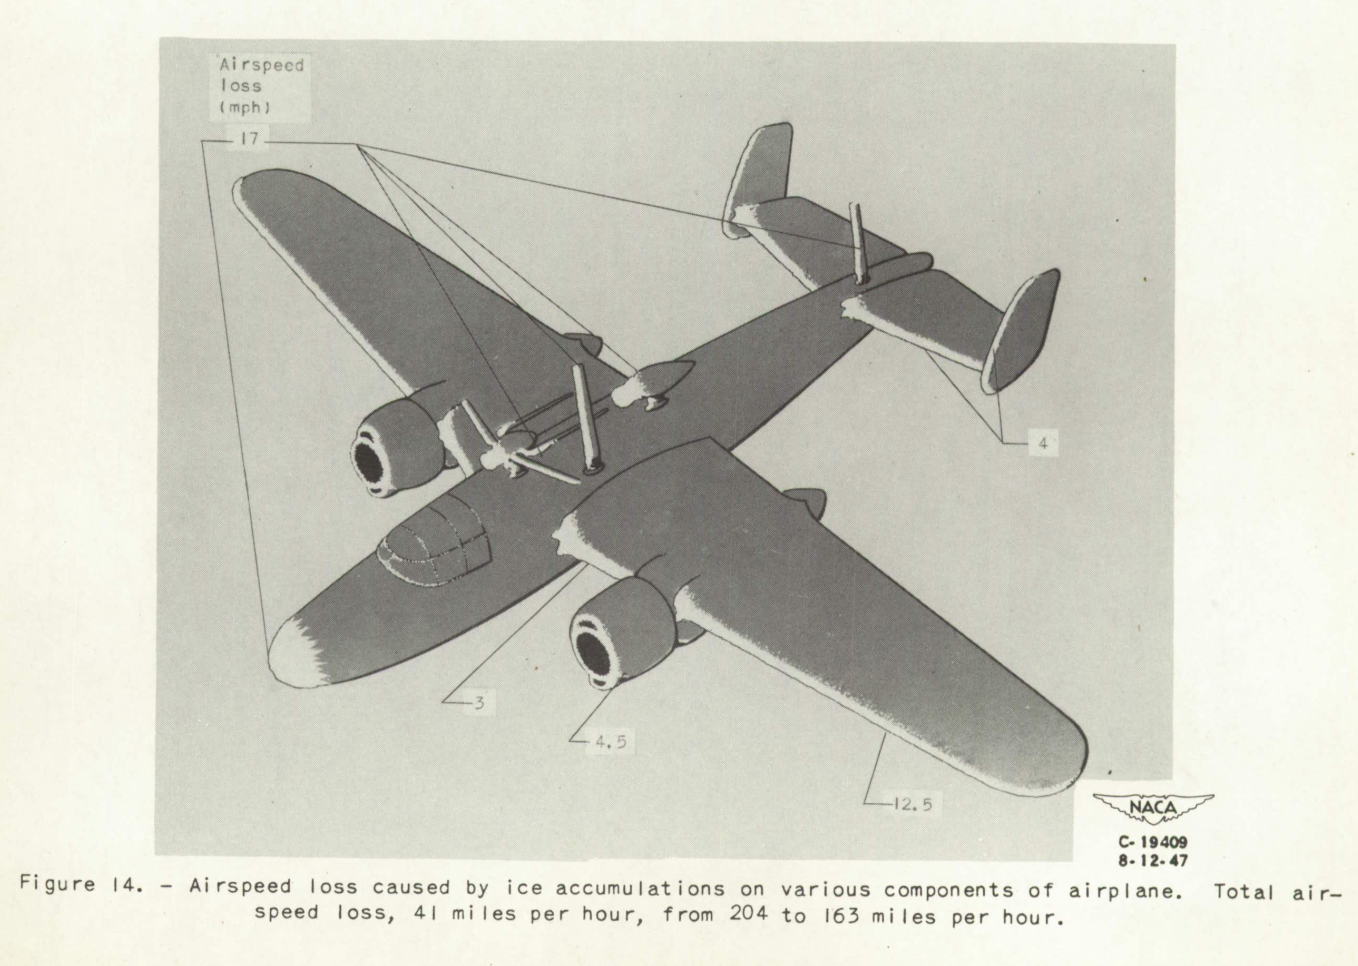
from "Effects of Ice Formations on Airplane Performance in Level Cruising Flight." NACA-TN-1598, 1948. ntrs.nasa.gov
As a final proof that everything works as intended, flight tests in natural icing conditions are conducted.
Glaze Ice formed in flight on an airplane:
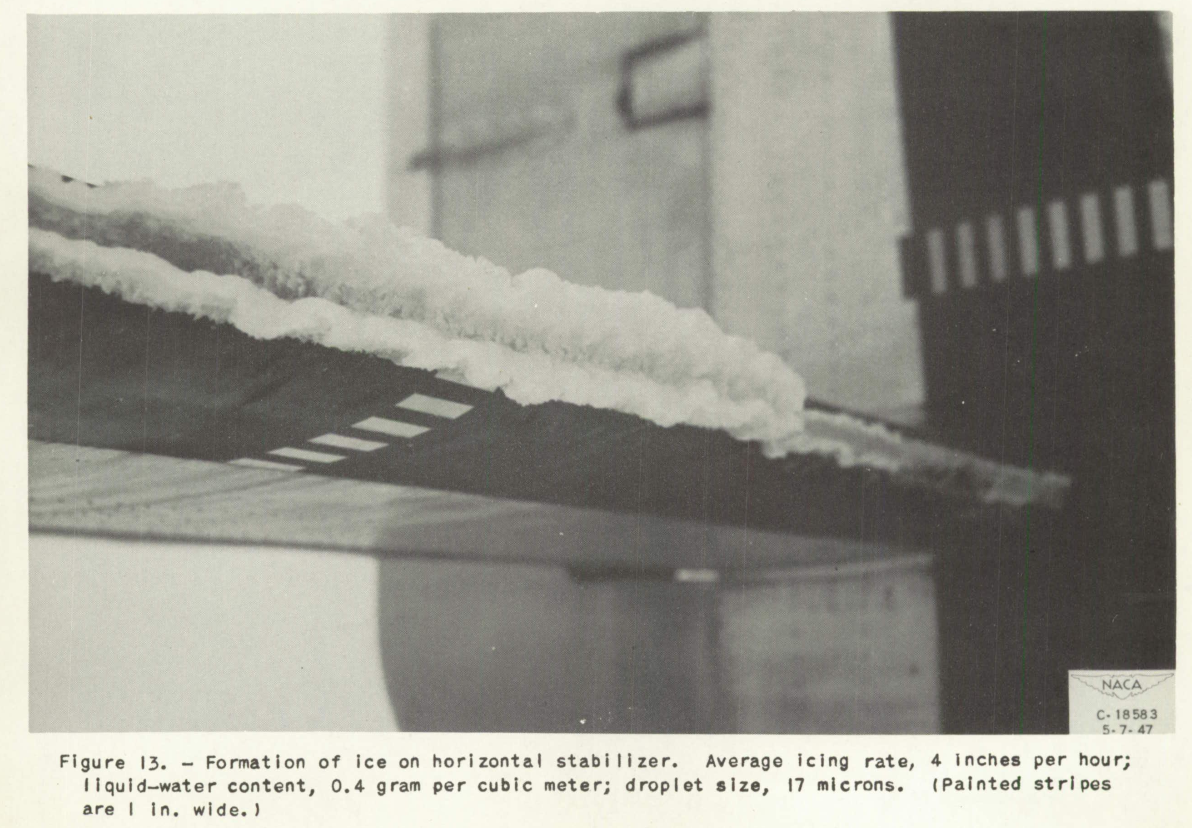
from "Effects of Ice Formations on Airplane Performance in Level Cruising Flight." NACA-TN-1598, 1948. ntrs.nasa.gov
Resources
Chapter IV of "Aircraft Icing Handbook Volume 2", DOT/FAA/CT-88/8-2. apps.dtic.mil
Design Guides resources.
The NASA-provided Icing Research Software (LEWICE, LEWICE 3D)
Icing wind tunnel resources.
"Introduction to Icing Certification" faa.gov
Related
This is part of The Basics series.