"Very few data are available on the physical properties of ice formations having a density other than that of clear, solid ice"
"Experimental Determination of Thermal Conductivity of Low-Density Ice" 1

Abstract
SUMMARY
The thermal conductivity of low-density ice has been computed from data obtained in an experimental investigation of the heat transfer and mass transfer by sublimation for an iced surface on a flat plate in a high-velocity tangential air stream.
The results are compared with data from several sources on the thermal conductivity of packed snow and solid glaze ice. The results show good agreement with the equations for the thermal conductivity of packed snow as a function of snow density. The agreement of the curves for packed snow near the solid ice regime with the values of thermal conductivity, of ice indicates that the curves are applicable over the entire-ice-density range.
Discussion
This publication is included in the Heat Transfer section of the "Selected Bibliography of NACA-NASA Aircraft Icing Publications"
INTRODUCTION
Removal of ice formations which accrete on aircraft surfaces from the impingement and freezing of cloud droplets has been the subject of a considerable amount of research in recent years. The accumulation of ice on aircraft surfaces occurs over a range of air temperatures from 32° F to as low as -40° F (ref. 1). The ice formations may be nearly clear glaze ice with little porosity, such as those formed at air temperatures near the freezing point, or they may be of the very porous type characterized by frost or ice formed at low temperatures. Some factors which affect the nature of the ice formations are the speed of the aircraft and the cloud droplet size and droplet size distribution.
Very few data are available on the physical properties of ice formations having a density other than that of clear, solid ice. Since much of the de-icing of aircraft is currently accomplished by the application of heat to the surface to be de-iced, knowledge of the thermal conductivity of ice is of importance in determining the heat lost through the ice. A similar problem is encountered in the determination of heat-transfer rates for frosted refrigeration equipment surfaces. A study of the mass transfer by sublimation and the heat transfer for an iced surface in a high-velocity air stream (ref. 2) required the determination of ice density, ice surface temperature, and rate of heat flow through the ice. From these data, the thermal conductivity of low-density ice has been determined for several values of ice density. The results obtained are presented herein and are combined with information from several sources to make possible a more complete evaluation of the thermal conductivity of ice over the entire range of ice density. The investigation was conducted in a 3.84- by 10-inch tunnel at the NACA Lewis laboratory.
Reference 2 is:
- Coles, Willard D., and Ruggeri, Robert S.: Experimental Investigation of Sublimation of Ice at Subsonic and Supersonic Speeds and its Relation to Heat Transfer. NACA-TN-3104, 1954. ntrs.nasa.gov
> review: NACA-TN-3104
METHOD, APPARATUS, AND PROCEDURE
The thermal conductivity of a substance is usually determined by means of standard laboratory procedures and equipment. Few such determinations have been made for low-density ice, however; and since the investigation reported in reference 2 supplied all the data necessary for the determination of thermal conductivity, the computations were made and are presented herein.
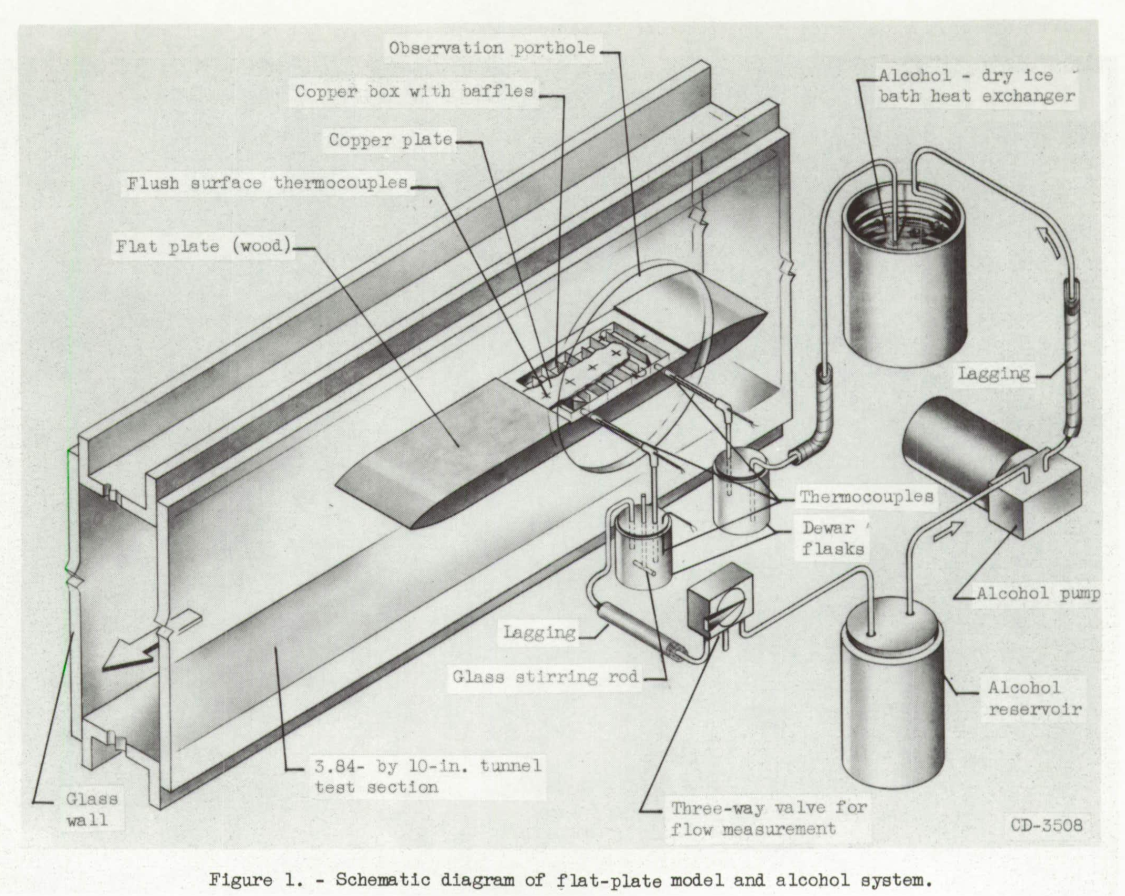
The ice formations to be studied were formed on a section of the upper surface of a flat-plate model which was mounted in the test section of the 3.84- by 10-inch tunnel. The ice which formed on the surface was then maintained at constant thickness (no net transfer of mass by sublimation or condensation) while the heat-flow rate and the temperature were measured. The condition of constant ice thickness was necessary for two reasons: (1) The stream-side surface temperature could be readily obtained only for the condition for which the surface temperature was equal to the temperature of saturation of the air stream, and (2) the thermal conductivity must be determined for steady-state conditions for a constant ice thickness.
The flat-plate model (shown in fig. 1) was 18 inches long, 0.75 inch thick, and 3.84 inches wide and was made of wood to minimize heat conduction through the model. One section of the upper surface of the model consisted of a 3.84- by 5.75-inch copper plate 1/16 inch thick set flush in the surface and located with its leading edge 4-7/16 inches from the leading edge of the model. The copper plate was the upper surface of a multipass copper box through which cold alcohol could be pumped. Five thermocouples were located in the surface of the copper plate spaced at 1-1/8-inch intervals along the center line. The thermo-couple leads passed through tubes in the alcohol chamber, and the thermocouple junctions were made flush with the outer plate surface. The tubes were soldered to the copper plate and to the bottom of the copper box. Additional thermocouples were located in the tunnel plenum chamber to measure the total temperature of the air stream and in the alcohol inlet and outlet lines to the copper box. A schematic diagram of the alcohol and thermocouple system is included in figure 1.

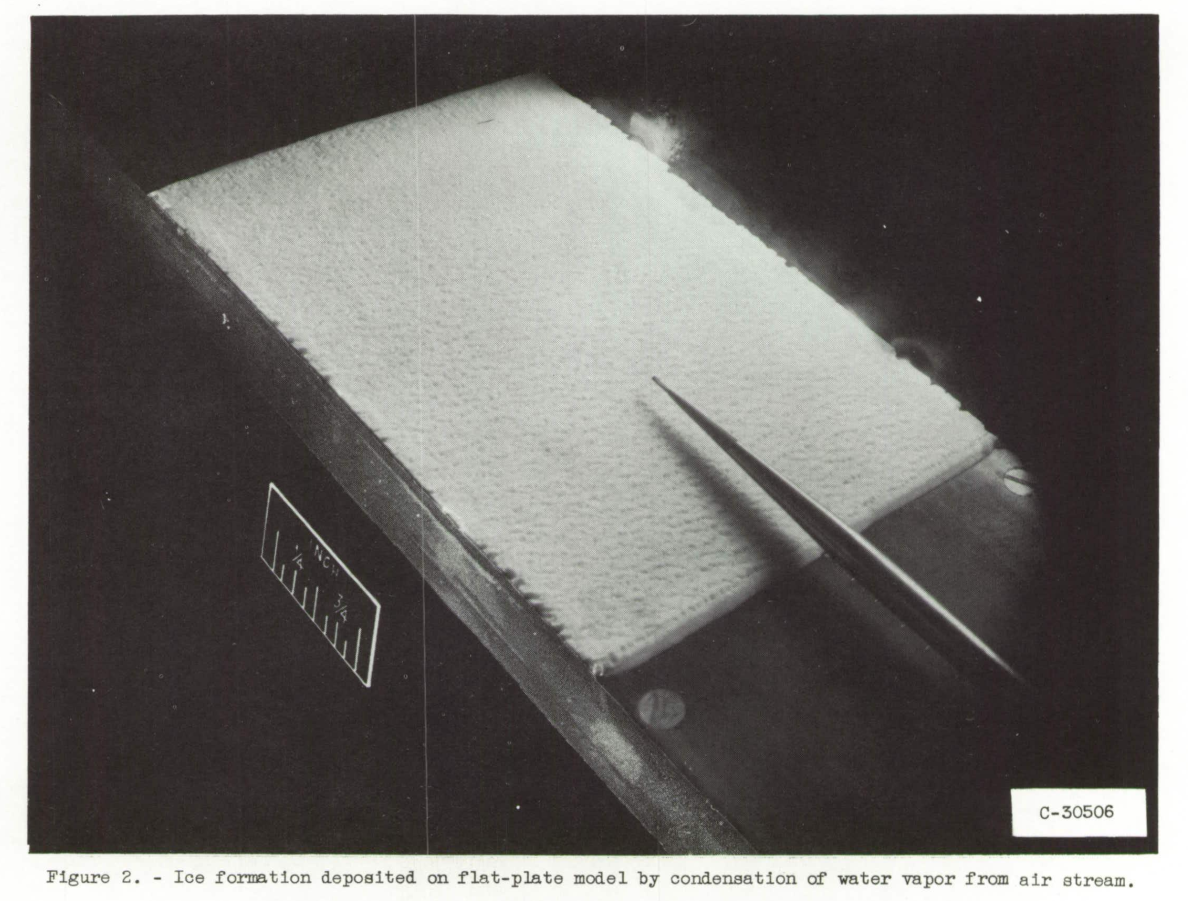
The mass-transfer investigation reported in reference 2 placed certain restrictions on the method of forming the ice which were best met by causing the water vapor in the humidity-controlled air stream to condense directly to the solid state on-the surface of the cold copper plate. The plate was cooled to a temperature below that of the frost point of the air stream by the flow of cold alcohol through the copper box. The alcohol was cooled In an alcohol-dry ice bath heat exchanger. The resultant ice formation thus took the form of a dense frost-like formation as shown in figure 2.

Ice formations were deposited on the refrigerated surface of the copper plate at nearly constant values of 5000 feet pressure altitude and 45° F total temperature of the air stream for Mach numbers of 0.4, 0.6, and 0.8. The thickness of the ice formation, which is dependent upon the humidity, velocity, and static pressure of the air stream, was controlled through regulation of the steam supply used for humidification of the air stream. The ice was allowed to form until a thickness of approximately 0.20 centimeter had been obtained. Measurements of the ice thickness while the tunnel was in operation were made through a window in the tunnel wall by the use of a short-focal-length telescope mounted on a vernier carriage. The telescope was focused on the pointer (fig. 2) which was directly above the center line of the copper plate. The depth of focus of the telescope was less than 3/4 inch; therefore, with the pointer in focus the ice surface viewed was within the range of approximately +/- 3/8 inch from the center line. The mean height of the ice surface was used in order to account for roughness projections and depressions.
RESULTS AND DISCUSSION
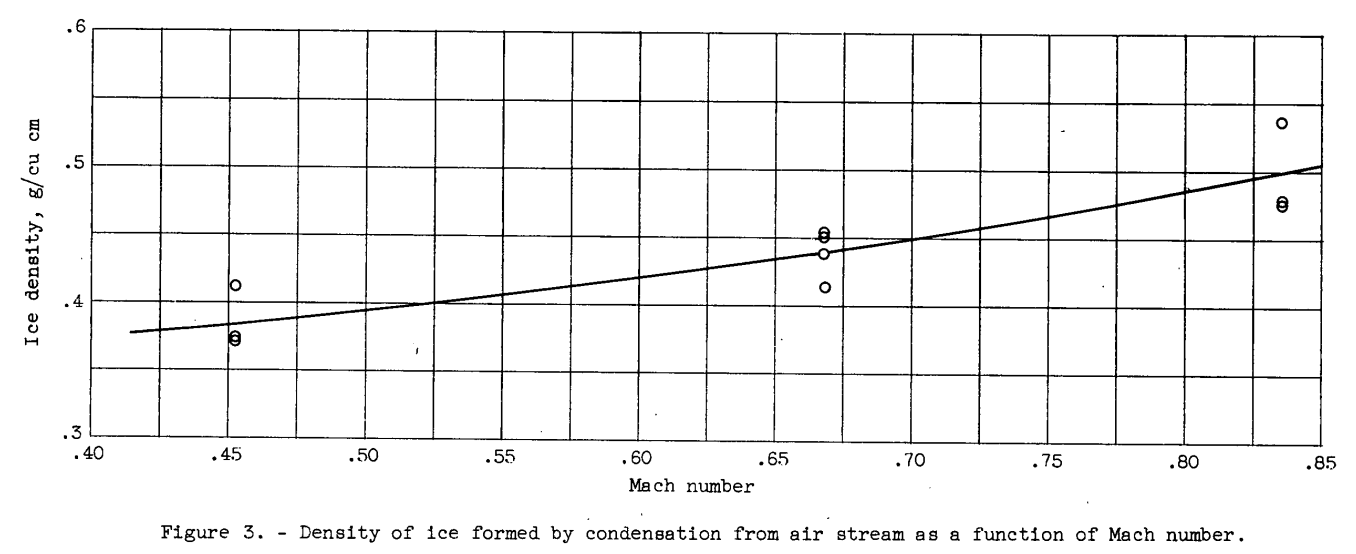
The density of the ice formed by the condensation of the vapor from the air stream at constant values of total temperature and pressure altitude varied as a function of the Mach number at which the ice was formed, as shown in figure 3. Average values of the ice density for three or more ice samples were determined for each Mach number.

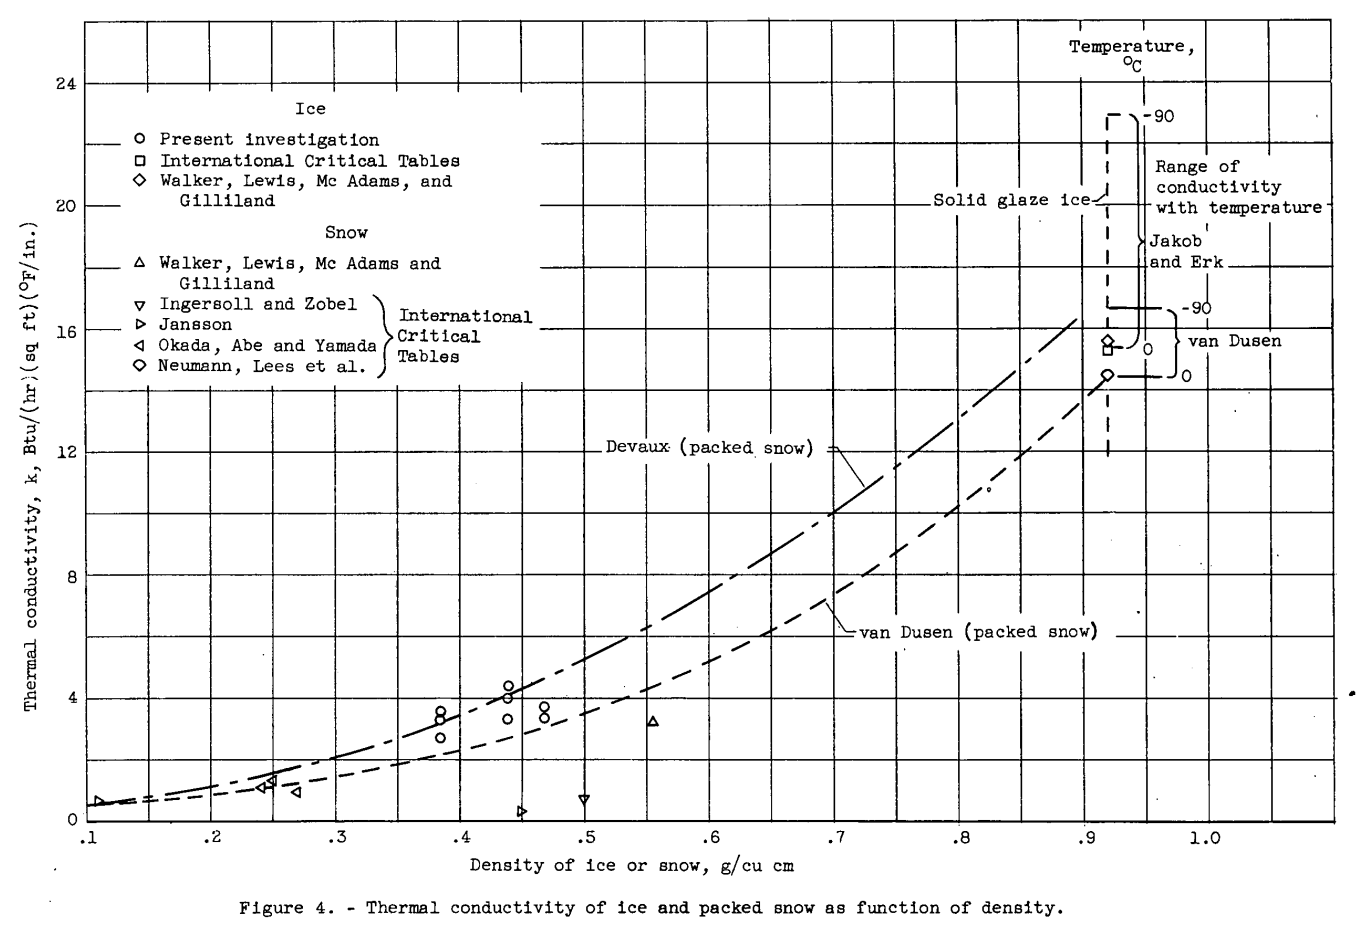
Values of the thermal conductivity of ice (Btu/(hr)(sq ft)(°F/in.)) were obtained for ice formed at Mach numbers of 0.4 to 0.8 and are presented in figure 4 as a function of the density (obtained from fig. 3) of the ice formation. The average temperature of the ice as determined from the average of the stream-side ice-surface temperature and the model-side plate-surface temperature was in the temperature range from 3° to -13° F. The values of thermal conductivity obtained showed no consistent variation with temperature for the temperature range used in this investigation. Included, in figure 4 are values obtained by several investigators as reported in references 4 to 6 for solid glaze ice and for packed snow. All the data points shown in figure 4 for densities less than 0.9 grams per cubic centimeter are for packed snow except for the results of the present investigation which are for ice formed by the condensation method.

The equations for the conductivity of packed snow determined by van Dusen (ref. 6)
k = 0.21 + 4.2ρ + 21.6ρ^3 milliwatt/(cm)(°C)
and by Devaux (ref. 7), for 0.1 < ρ <0.6,
k = 0.29 (1 + 10Oρ^2 ) milliwatt/(cm)(°C)
have been computed over the range of density from ρ = 0.1 to that of solid ice (approximately 0.92) and are shown as dashed lines on the figure. The ranges of thermal conductivity of solid, glaze ice for temperatures from 0° to -90° C as given in reference 6 from computations of van Dusen t s equations (k = 20.9 (1 - 0.0017t) milliwatt/(cm)(°C) and by Jakob and Erk (ref. 6) are also presented. van Dusen shows a relatively small increase in thermal-conductivity values with decrease in ice temperature, while the work of Jakob and Erk, which is more recent, shows a considerably greater change with temperature. The equations of van Dusen and Devaux for packed snow with a density near that of solid ice show good agreement with all the results presented for solid ice except for the low-temperature results of Jakob and Erk. The values of thermal conductivity determined in the present investigation are, for the most part, bounded by the van Dusen and Devaux curves. The spread in the data is of the order of the error indicated by the analysis of the precision of the measurements.
The values of thermal conductivity of snow at densities of 0.45 and 0.5 gram per cubic centimeter, as taken from the International Critical Tables from the results of Jansson and from Ingersoll and Zobel, appear low when compared with the value Jansson reported at a density of 0.11 grain per cubic centimeter and the other data of figure 4. The data and curves shown in figure 4 indicate that either the Devaux or the van Dusen curves will probably give good approximation of the thermal conductivity of ice over the whole range of ice densities; it appears probable that the use of the van Dusen curve may result in values of thermal conductivity which are too low for ice at very low temperatures.
Conclusions
Values of the thermal conductivity of low-density ice formed by a condensation process on a cold surface have been determined. The data show good agreement with the equations of van Thisen and Devaux for the thermal conductivity of packed snow as a function of the snow density.
Citations
This study is cited by 31 publications, per scholar.google.com.
Related
See
NACA-TN-3104 and NACA-TN-3396
which used the same test facility.
Also see
NACA-TN-2861 "Analytical Investigation of Icing Limit for Diamond Shaped Airfoil in Transonic and Supersonic Flow"
and
NACA-TN-2914 "A Method for Rapid Determination of the Icing Limit of a Body in Terms of the Stream Conditions",
which analyze transonic flow cases.
Reviews (combined): NACA-TN-2914
Notes
-
Coles, Willard D.: Experimental Determination of Thermal Conductivity of Low-Density Ice. NACA-TN-3143, 1954. ntrs.nasa.gov ↩