"high-speed, high-altitude airplanes will encounter much less icing than older type airplanes"
"NACA Conference on Some Problems of Aircraft Operation" 1
Abstract
The formation of ice on aircraft in flight is caused by the freezing of supercooled liquid -water droplets as they strike the exposed surfaces of the aircraft. Icing conditions exist, therefore, when free water in the liquid state is present in the air at temperatures below freezing.
Such conditions are frequently found in clouds, but not all clouds at subfreezing temperatures produce icing. Some clouds are composed entirely of ice crystals, which, in the absence of liquid water, do not adhere to the aircraft and therefore do not cause icing. Subfreezing clouds thus may be divided into three classes depending on whether they are composed of ice crystals, liquid-water droplets, or a mixture of crystals and drops. The latter two types, liquid and mixed clouds, are icing clouds.
The average frequency of occurrence of clouds in general and icing clouds in particular is a function of altitude, temperature, and seasonal and climatic factors which vary with geographical location. The specific problems concerned with the probable frequency and severity of icing conditions to be expected in the operation of highspeed high-altitude aircraft are considered in this paper, as compared with the icing conditions encountered on older types of aircraft.
Discussion
INTRODUCTION
This volume contains copies of the technical papers presented at the NACA Conference On Some Problems of Aircraft Operation on November 17 and 18 , 1954 at the Lewis Flight Propulsion Laboratory . A list of the conferees, who are members of the aircraft industry and the military services, is included.
The conference in 1954 had 21 presentations, two of which were on aircraft icing topics.
Here, "Icing Conditions to be Expected in Operation of High-Speed, High-Altitude Airplanes" by Uwe von Glahn is reproduced in its entirety.
There are two general aspects of this problem. In the first place, icing conditions occur less frequently at high than at low altitudes; hence, airplanes cruising at high altitudes will encounter less icing en route. The first phase of this discussion will therefore be concerned with the frequency and probable severity of icing conditions at high altitudes. High-altitude airplanes, however, must still climb and descend through the lower layers of the atmosphere where icing conditions are more frequent; therefore, the second phase of this discussion will deal with the effect of aerodynamic heating, due to high airspeed, on the icing potentialities of clouds encountered at low altitudes.
An appraisal of the effect of high cruise altitude on icing requires data on the frequency of occurrence of clouds and icing conditions at high altitudes. Through the cooperation of the Air Force, the records of a large number of flight weather observations taken at regular intervals during routine operations have recently been obtained. The analysis of these records is now in progress at the NACA Lewis laboratory, and the results thus far obtained give some insight into conditions existing at high altitudes. A total of more than 15,000 observations taken at altitudes of 20,000 feet or more has been used for a survey of high-altitude icing conditions. These observations are mainly from the United States, including only a small percentage from various outside areas. Within the United States, the observations are unevenly distributed with the heaviest concentration along the Pacific Coast and in the Great Plains.
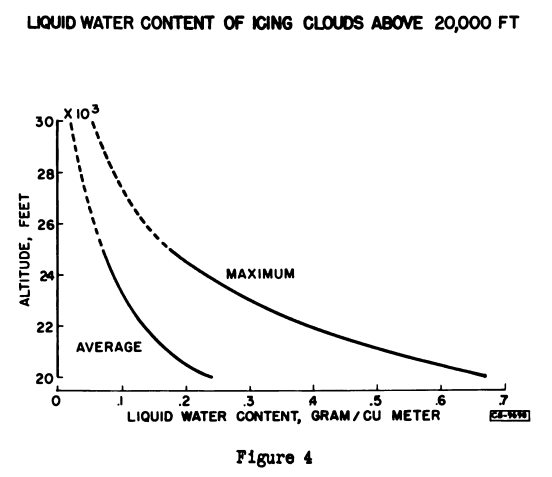
Figure 1 shows the frequency of clouds and icing conditions at altitudes above 20,000 feet. The coordinates of the diagram are temperature and altitude, and the cloud and icing frequencies are represented by contour lines. The solid lines show the percentage of observations in which the airplane was flying in continuous or intermittent clouds. For example, any point on the 3-percent line represents a condition of temperature and altitude in which cloudiness occurred 3-percent of the time. The dotted lines represent, in a similar way, the percentage of time in icing conditions. However, in this case, the contour interval is smaller by a factor of 10 because of the lower frequency of icing conditions. The pattern of cloud frequencies shows a distinct maximum of over 7 percent occurring along a line which corresponds to the normal winter temperature-altitude relation in the North Pacific Coast area. This feature is probably related to the preponderance of data from this area and the prevalance of winter storminess there.
The low frequency of cloudiness associated with abnormally high temperatures is believed to be a more basic relation, representative of temperate-latitude conditions in general, since high temperatures at high altitudes are associated with a stable stratification of the lower atmosphere in which moisture-laden air cannot penetrate to high altitudes. For similar reasons, the cloud frequency is fairly high in conditions of below-average temperature aloft because a higher degree of atmospheric instability favors the ascent of moist air to high altitudes.
The distribution of icing frequencies is not so well defined as that of cloud frequencies because it is based on a total of only 28 cases of icing. The maximum frequency of icing, about 1/2 percent at 20,000 feet, occurs at about -20° C, a somewhat higher temperature than the cloud maximum frequency. In the region of temperatures below about -350 C and altitudes above about 27,000 feet, the frequency of icing is nearly zero, whereas the frequency of clouds is considerable. these conditions, the clouds are composed entirely of ice crystals.
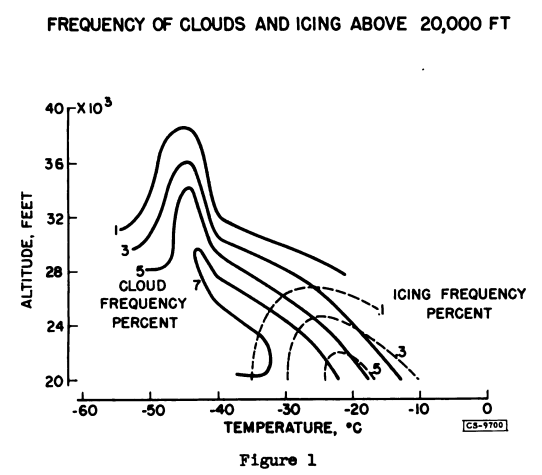
Figure 2 shows the variation with temperature of the percent of time in icing, percent of time in cloud, and the ratio of icing to cloud frequency. In this figure, the icing frequency scale is expanded by a factor of 10. The decrease of icing frequency at temperatures above about -21° C is a direct consequence of the decrease of cloud frequency. As the temperature decreases from -20° to -40° C, however, the frequency of icing decreases to zero while the cloud frequency increases slightly and then remains fairly constant. These features result from the variation with temperature of the icing- to cloud-frequency ratio. This ratio represents the percentage of clouds in which liquid-water droplets are present, and its decrease with decreasing temperature reflects the increasing tendency for the formation of ice crystals at lower temperatures. The maximum slope of the icing-ratio curve occurs at about -25° C. This is approximately the freezing temperature of an appreciable fraction of droplets in the 10- to 20-micron size range as determined by measurements made at the NACA Lewis laboratory a few years ago. Agreement is also noted between the temperature at which the icing frequency reaches zero (about -40° C) and the minimum temperature of supercooling of water droplets observed in laboratory experiments.
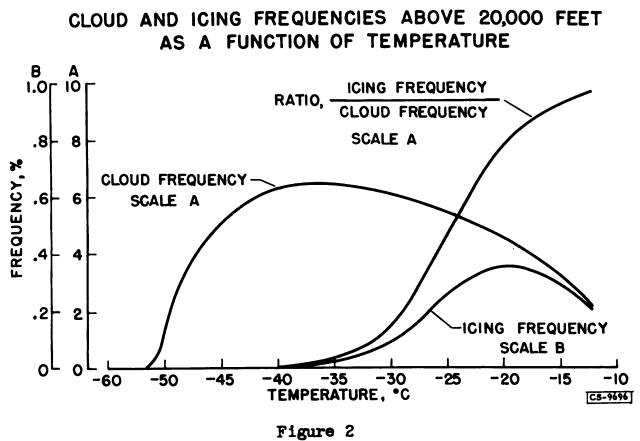
Figure 3 shows the preceding quantities as a function of altitude. In this case, the frequencies of both cloudiness and icing decrease continuously with increasing altitude, the decrease being more rapid for icing. The icing- to cloud-frequency ratio decreases from about 7 percent at 20,000 feet to nearly zero at about 29,000 feet. This variation is regarded as being a consequence of the more fundamental variation with temperature. The actual frequency of icing decreases from about 0.4 percent at 20,000 feet to negligible values at about 29,000 feet.
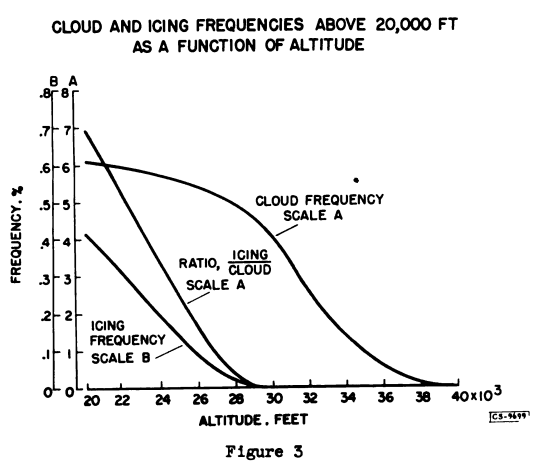
In addition to the icing frequency data which have just been discussed, a limited amount of data on liquid-water content at altitudes above 20,000 feet have been obtained in a statistical icing-rate program. Figure 4 shows average and maximum measured values of liquid-water content as a function of altitude. These curves show a marked decrease of liquid-water content with altitude. Although the exact values are uncertain at high altitudes, it may be inferred that on the rare occasions when icing does occur at altitudes above about 25,000 feet, the probable average value of liquid-water content is less than 0.1 gram per cubic meter and maximum values are likely to be approximately 0.2 gram per cubic meter.

On the basis of these results, it would appear that only a very low frequency of light icing is to be expected at altitudes above about 25,000 feet and that above 30,000 feet the probability of encountering icing is practically zero. Some qualification of this conclusion is necessary, however, since these data are mainly from the United States and the flights did not deliberately seek either clouds or icing. Considerable evidence is available to indicate that clouds in tropical areas extend to greater heights than in temperate latitudes, and it is reasonable to assume that icing conditions also occur at higher altitudes. A study of average temperature-altitude relations in tropical areas, as compared with temperate latitudes, in the light of the relation between temperature and the icing- to cloud-frequency ratio leads to an estimate for tropical areas of very low icing frequencies above 30,000 feet with a practical upper limit for icing somewhere in the neighborhood of 38,000 feet.
As a general conclusion, it may be stated with reasonable confidence that icing en route is not likely to be an important problem for airplanes cruising at altitudes above about 30,000 feet. In this altitude range, the most likely condition in which icing of significant intensity might be expected is in the tops of active cumulonimbus clouds. Since such clouds are usually avoided because of turbulence, it is to be expected that icing encounters will be very infrequent.
The icing problems to be expected at lower altitudes during climb and descent with high-speed, high-altitude airplanes are now discussed. Since relatively high rates of ascent and descent are considered instead of continuous horizontal flight, the vertical thickness of the icingcloud layers is of more importance than their horizontal extent. general rule, the vertical thickness of single icing-cloud layers is less than 3000 feet, while closely spaced multiple layers seldom exceed about 6000 feet in total thickness. The total time in icing, therefore, is unlikely to be more than 2 or 3 minutes.
Thus, it is seen that during climb and descent with high-speed, high-altitude airplanes, low-altitude icing will consist of brief encounters instead of sustained flight in icing conditions. Moreover, the frequency and severity of these brief encounters is substantially reduced at high airspeeds because aerodynamic heating functions like a thermal ice-prevention system, providing sufficient heat to prevent icing in the upper portion of the icing-temperature range.
In low-speed airplane operation, a considerable fraction of the low altitude icing encounters occurs at air temperatures only a few degrees below freezing. High-speed airplanes, however, can operate in many of these conditions without collecting ice because aerodynamic heating keeps the airplane surface temperature above the freezing point. Thus, increased airspeed leads to a reduced frequency of icing at low altitudes. Moreover, because higher values of liquid-water content generally occur at temperatures close to freezing, the icing encounters that are eliminated by aerodynamic heating are the very ones most likely to cause high rates of ice formation on low-speed airplanes.
Before the effect of aerodynamic heating on the expected icing experience of high-speed airplanes is further discussed, the probable effect of thermal lag, which might possibly be important in high rates of descent with thick-skinned airplanes, is briefly mentioned. During ascent, the lag in thermal response of the airplane will result in higher wing surface temperatures than would occur in level flight, thus reducing the tendency for icing. On the other hand, high rates of descent might be expected to result in lower surface temperatures. However, the fact must not be overlooked that, because of the absence of evaporation, the kinetic temperature rise in clear air is nearly twice as great as the wet-air temperature rise; at 500 miles per hour, this difference amounts to about 10° C, or 5000 feet of altitude at the standard atmosphere lapse rate. Thus, if the time lag in thermal response of a wing is 1 minute or less, and if the rate of descent is less than 5000 feet per minute, the surface temperature of an airplane entering a cloud at 500 miles per hour would still be above the wet-air equilibrium temperature. The effect of the thermal lag, therefore, is not likely to lead to a surface temperature much below the equilibrium wet-air kinetic temperature except in cases of extremely rapid descent. The results of calculations based on steady-state conditions in wet air are used in the remainder of the discussion.
Figures 5 to 7 show the influence of aerodynamic heating on the effective frequency and severity of encounters with icing conditions at altitudes below 20,000 feet. These curves are based on data obtained through the cooperation of the airlines and the Air Force, in the Lewis laboratory statistical icing-rate program; NACA pressure-type icing-rate meters were used.
In figure 5, the figure at the left shows the aerodynamic heating effect, expressed as the relation between true airspeed and the calculated "icing limit" temperature, that is, the air temperature under the conditions at which ice will just begin to form on an airfoil surface. The right-hand figure is a cumulative frequency curve showing the distribution of icing encounters with temperature. The ordinate is the air temperature, and the abscissa the ratio of the number of encounters below a given temperature to the total number of encounters.
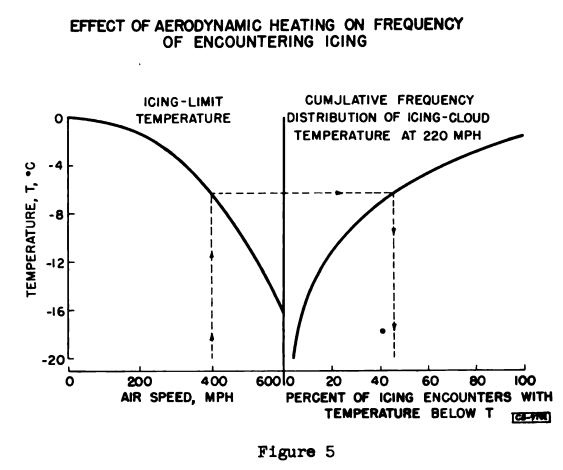
This frequency distribution is based on data obtained at an average airspeed of about 220 miles per hour, the speed at which the wet-air kinetic heating effect amounts to about 1.6° C; hence, the distribution includes all icing encounters at temperature below -1.60 C. The two curves may be used to compare the frequency of icing that would be encountered by a high-speed airplane with the icing frequency experienced at 220 miles per hour. For example, at a speed of 400 miles per hour the aerodynamic heating curve indicates that icing can occur only at air temperatures below -6.3° C, and from the icing frequency curve it is found that 46 percent of the icing encountered at 220 miles per hour occurred at air temperatures below -6.3° C. The effective icing frequency at 400 miles per hour is therefore only 46 percent of the frequency at 220 miles per hour, the remaining 54 percent of the icing encounters having been eliminated by aerodynamic heating.
In this way, a relation may be obtained between airspeed and icing frequency as shown in figure 6. The lower curve gives a comparisonbetween the effective icing frequency at high airspeeds and the frequency encountered at 220 miles per hour. Thus, for every 100 icing encounters at 220 miles per hour, 76 would be expected at 300 miles per hour, 46 at 400 miles per hour, and 22 at 500 miles per hour.
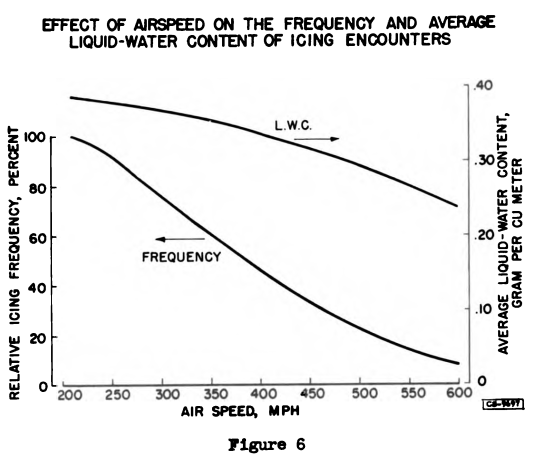
The upper curve, which was derived in a similar way from statistical data on liquid-water content, shows the effect of high airspeed on the average liquid-water content of clouds in which icing occurs. It appears paradoxical that the average liquid-water content of icing clouds should be a function of airspeed, since the composition of the clouds is obviously not influenced by the speed of an airplane flying through them. The explanation is that the icing conditions which affect a high-speed airplane constitute a selected sample of clouds including only those at temperatures below the icing-limit temperature. Since the average liquid-water content of clouds decreases with decreasing temperature, the effect of increasing airspeed is selectively to eliminate the icing conditions having the greatest liquid-water content. The average liquid-water content of the remainder thus decreases with increasing airspeed.
At 220 miles per hour the average liquid-water content is nearly 0.4 gram per cubic meter, while at 500 miles per hour, it is about 0.3 gram per cubic meter - a reduction of about 25 percent.
Figure 7 shows the variation with airspeed of the probability of exceeding 0.5, 0.8, and 1.0 gram per cubic meter of liquid water. A logarithmic probability scale is used because of the large range of probability from 1 to 1/5000. The unit of data on which the probabilities are based is one encounter with clouds in which an airplane flying at 220 miles per hour would experience icing. For example, at 400 miles per hour, the probability of exceeding 1 gram per cubic meter is about 0.01. This means that an average of one in 100 encounters with clouds that would cause icing at 220 miles per hour may be expected to contain 1 or more gram per cubic meter of liquid-water content at a temperature low enough to cause icing at 400 miles per hour. A change in airspeed from 220 to 500 miles per hour reduces the probability of encountering icing with 0.5 gram per cubic meter from 0.35 to 0.04, or by a factor of about 9. For a liquid-water content of 1 gram per cubic meter, the same change in airspeed reduces the probability by a factor of 20, from 0.04 to 0.002. Thus, increasing airspeed has a greater relative effect on the probability of encountering high values of liquid-water content than low values.
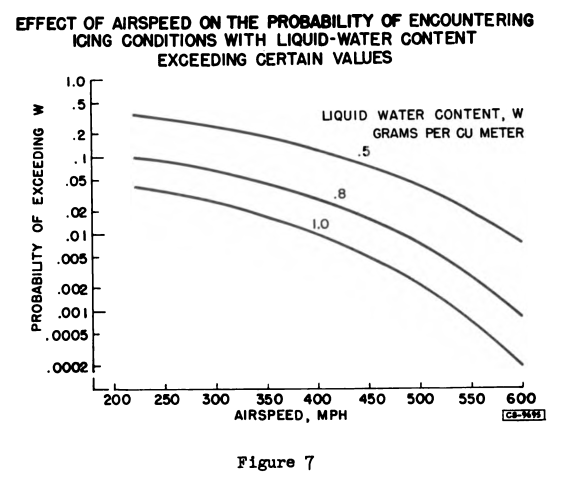
Aerodynamic heating at high airspeeds has been seen to cause a marked reduction in the frequency of encountering icing and a moderate reduction in the average liquid-water content of the remaining icing conditions. These factors combine to produce a very significant reduction in the probability of encountering high values of liquid-water content in icing conditions.
Conclusions
These results show that during climb and descent, as well as en route, high-speed, high-altitude airplanes will encounter much less icing than older type airplanes.
This publication defined the icing environments that are used in the next presentation, "Some Considerations for the Need of Icing Protection of High-Speed, High-Altitude Airplanes".
Notes
-
von Glahn, Uwe H.: Icing Conditions to be Expected in Operation of High-Speed, High-Altitude Airplanes NACA Conference on Some Problems of Aircraft Operation. NASA-TM-82265, 1954. books.google.com ↩